S&P Global Offerings
Featured Topics
Featured Products
Events
S&P Global Offerings
Featured Topics
Featured Products
Events
S&P Global Offerings
Featured Topics
Featured Products
Events
Banking & Capital Markets
Economy & Finance
Energy Transition & Sustainability
Technology & Innovation
Podcasts & Newsletters
Banking & Capital Markets
Economy & Finance
Energy Transition & Sustainability
Technology & Innovation
Podcasts & Newsletters
S&P Global Offerings
Featured Topics
Featured Products
Events
Research — 2 Nov, 2023

By Adam Wilson
Transmission and distribution constraints remain a key barrier to US energy transition efforts as wind, solar and battery storage projects continue to pile up in interconnection queues across the country. In addition to grid interconnection bottlenecks, lagging upgrades to the country's existing transmission infrastructure are leading to increasing curtailment and congestion costs across many independent system operators, especially those with high renewables penetration.

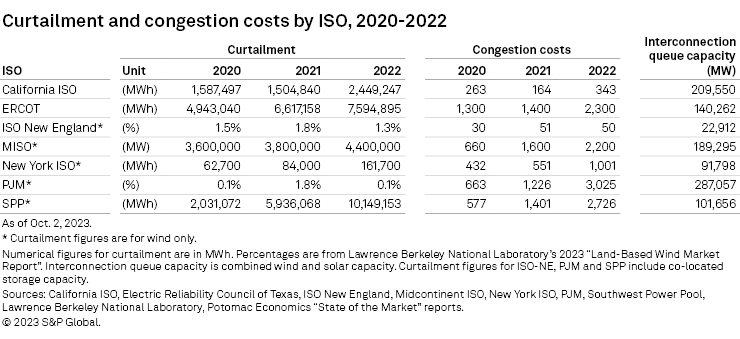
Transmission and distribution constraints remain a key barrier to the energy transition, as evidenced by steadily increasing curtailment and congestion costs across most independent system operators. CAISO, ERCOT, MISO, NYISO and SPP all set new highs for wind curtailment in 2022 while cumulative day-ahead congestions costs reached $11.6 billion — an 82% increase from 2021.
Billions of dollars are being dedicated to grid infrastructure upgrades. The US Department of Energy recently announced $12.5 billion for transmission projects, and several ISOs are also allocating funds to modernize the grid and help integrate incoming renewable generation. Transmission and distribution capital expenditure continues to nudge upward, with 2023 projections topping $300 billion.
Despite increasing momentum for transmission line upgrades, questions remain whether these projects can match the pace of intermittent renewable generation coming online on the heels of the Inflation Reduction Act of 2022. Over 1,000 GW of wind and solar capacity are in interconnection queues across the seven ISOs in the US. Just a quarter of this capacity reaching commissioning would double the current operating fleet of these technologies.

Curtailment, congestion costs continue upward trajectory
More than a year after its signing into law, the Inflation Reduction Act of 2022 is in full swing, with long-term extensions of the production and investment tax credits prompting a substantial boost of development interest for wind, solar and battery storage capacity across the country. This is reflected by burgeoning interconnection queues, with cumulative wind and solar capacity across the seven ISOs surpassing 1,000 GW — more than quadruple the current grid-scale operating capacity of these technologies.
In July 2023, the Federal Energy Regulatory Commission issued a rule intended to alleviate the growing backlog of clean energy projects in interconnection queues by prioritizing those closest to commercial operation. The multiyear delays for incoming power plants have also prompted independent system operators to investigate solutions to expedite project commissioning.
Beyond new project integration, transmission constraints are increasing curtailment of existing wind and solar generation across much of the country and contributing to rapidly rising congestion costs. California ISO set a record in 2022 with nearly 2.5 million MWh of wind and solar generation curtailed. The grid operator set a monthly record in April 2022 with almost 600,000 MWh of generation curtailed — more than 250,000 MWh higher than the previous monthly record. CAISO is on pace to exceed the annual curtailment high again in 2023, with April breaking the monthly record again with 700,000 MWh of curtailed renewable generation.

Southwest Power Pool has some of the fastest-growing curtailment rates of any ISO. Curtailed wind generation was just over 2 million MWh in 2020 and grew to 10.1 million MWh in 2022 — a fivefold increase in two years. According to Lawrence Berkeley National Laboratory's 2023 land-based wind market report, over 9% of wind generation in SPP was curtailed in 2022 — the highest percentage among ISOs that year.
In the Electric Reliability Council of Texas Inc., combined wind and solar curtailment has steadily risen, reaching 7.6 million MWh in 2022, an increase of nearly 1 million MWh from 2021. Curtailment rates in ERCOT reached a high in 2009, when over 17% of wind generation was curtailed, prompting the Competitive Renewable Energy Zones (CREZ) project, a $7 billion grid upgrade endeavor. After the project's completion in 2013, curtailment rates plummeted to a low of 0.5% in 2014.
With no significant efforts toward transmission expansion since the CREZ project, renewable generation in ERCOT is again showing signs of outgrowing existing grid capabilities, with curtailment rising back up to 5% as of 2022. Renewable development does not appear to be slowing, with 140 GW of wind and solar in the interconnection queue in ERCOT. Midcontinent ISO and New York Independent System Operator Inc. are also experiencing increasing curtailment as renewable penetration has grown, while comparatively modest renewable growth in ISO New England has kept curtailment rates consistently low. PJM Interconnection LLC does not reliably report curtailment figures.
ISOs' annual congestion costs provide another direct measure of grid congestion. If transmission congestion is high enough, energy providers may be unable to access lower-priced generation far away from major load centers, resorting instead to closer but higher-priced generation. Cumulative day-ahead congestion costs of the seven ISOs in 2022 surpassed $11.6 billion — nearly triple the figure just two years earlier. PJM had the highest, at over $3 billion; SPP was second with over $2.7 billion, and both ERCOT and MISO exceeded the $2 billion mark. ISO-NE's comparatively miniscule figure of $50 million, along with its low curtailment rates, further indicates transmission congestion there being not as severe as in other ISOs.
Investment increasing but progress remains slow
While robust tax incentives for clean energy projects were a key component of the Inflation Reduction Act, some critics have pointed out the lack of a comparable investment tax credit for transmission and distribution (T&D) projects as an oversight in the bill. Funds were set aside for grid infrastructure improvements, however, including $12.5 billion from the Building a Better Grid initiative that tapped money allocated in the Infrastructure Investment and Jobs Act.
More recently, the US Department of Energy announced 58 grid projects across the country to receive $3.5 billion in funding as part of the first stage of investments toward boosting the resiliency and efficiency of the nation's grid. The DOE reported that total investments for this round of projects would exceed $8 billion once private-sector commitments are included. A second round of funding is expected to open before the end of 2023.

Over 20,000 miles of transmission line projects are in development across the US. One of the largest is SunZia, the 550-mile, 525-kV high-voltage direct current (HVDC) project running from New Mexico to Arizona. The project, operated by Pattern Energy Group Inc., is expected to be fully operational by 2026.
Analysis of the SunZia transmission project forecasts a significant increase in power flow from New Mexico — which has over 10 GW of wind, solar and battery storage capacity in planning — into Arizona, where energy demand is expected to increase due to population growth and datacenter development. According to the Market Intelligence Power Forecast, the project will also help decrease energy prices in both states and prompt further displacement of legacy fossil fuel generation.
A similar case study was done for the 339-mile HVDC Champlain Hudson Power Express (CHPE) line, which will carry wind and hydroelectric generation from Quebec into the New York City metropolitan area. The line is forecast to boost clean energy imports into New York City by 866 MW annually in addition to driving down wholesale next-day energy prices. The benefits of these long-range HVDC lines are clear despite their hefty up-front price tags; the SunZia and CHPE projects combined will cost an estimated $8 billion.
Currently, 12 long-range HVDC transmission projects are in development in the US. In addition to the SunZia and CHPE lines, the 800-mile Grain Belt Express line is in advanced development across two phases and will transport up to 5,000 MW of electricity between SPP and MISO. The first phase of the project, developed by Invenergy LLC, received final approval from the Missouri Public Service Commission Oct. 12.

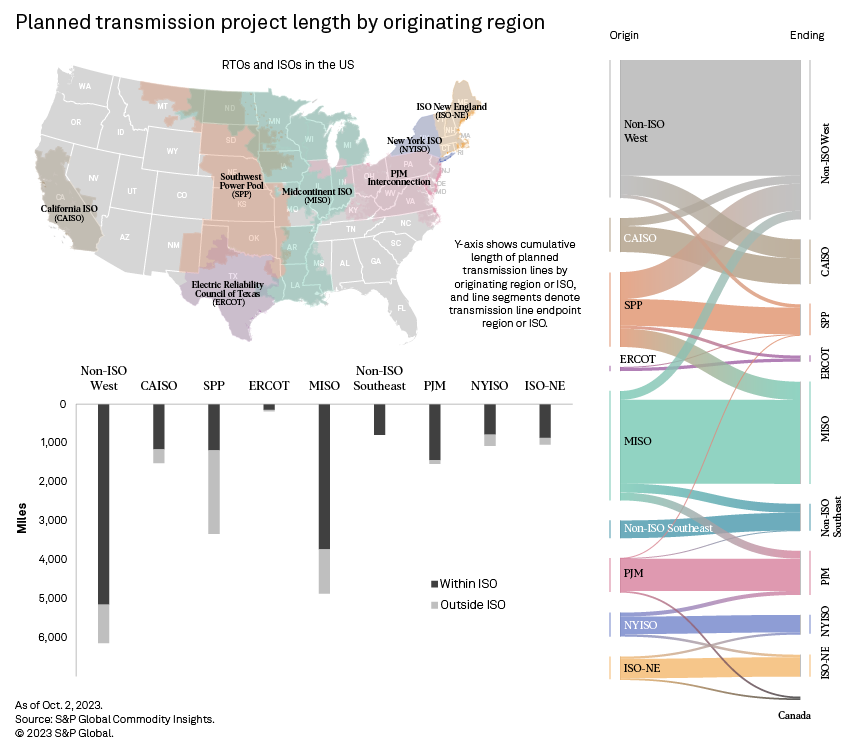
MISO has the most transmission line miles in planning of all ISOs at over 4,800 miles, with three-quarters of these lines being confined within the MISO footprint. In July 2022, MISO approved a $10.3 billion transmission plan that includes 18 different transmission projects capable of supporting up to 53 GW of renewable generation.
MISO and SPP conducted a joint study in 2022 exploring the development of multiple interregional transmission lines at a cost of about $1.65 billion. According to the study, the projects would resolve 33 reliability constraints in MISO and 15 in SPP. According to Market Intelligence data, 811 miles of transmission lines connecting MISO and SPP are in development. SPP has over 3,300 miles of transmission projects in development but is unique in that most planned projects end outside the ISO's territory.
CAISO, ISO New England, New York ISO and PJM all have over 1,000 miles of transmission projects planned. Outside ISO footprints, the Western US has over 6,100 miles of transmission miles in development, in anticipation of integrating the over 100 GW of wind, solar and battery storage in planning across the region. More than 1,000 miles of transmission lines are planned to connect CAISO and the Western US in efforts to bolster the Western Energy Imbalance Market, which allows real-time access to least-cost electricity in the region.
Transmission capex on the rise
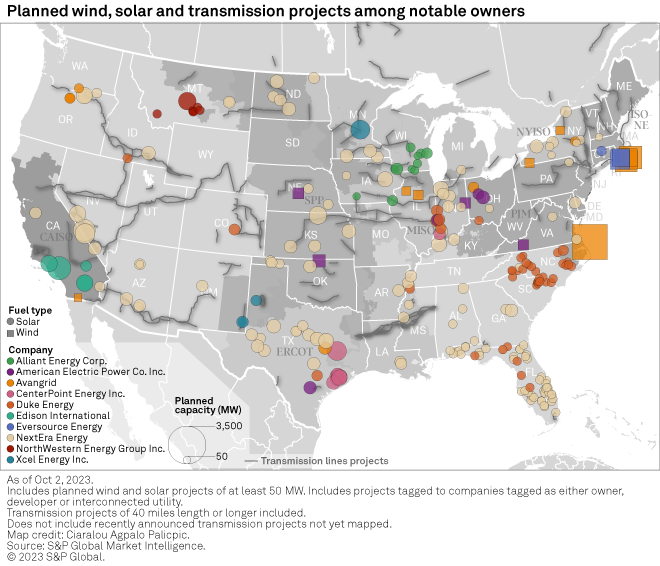
According to Regulatory Research Associates' spring 2023 capital expenditures outlook, T&D capital expenditure among major US utilities is expected to top $300 billion through 2027. This represents a 5% increase from the 2022 T&D capex outlook. American Electric Power Co. Inc. leads all companies in planned transmission capex over the next five years at $15 billion. AEP's combined T&D capex over the next five years is $25.8 billion. The Columbus, Ohio-based energy company is either an owner, developer or interconnected utility of 2.2 GW of planned renewable capacity.
Among the leaders in planned T&D capex, NextEra Energy Inc. has the most renewable capacity in development, with over 23 GW. The company is one of the most active renewable developers in the US and, not surprisingly, is also among the leaders in planned T&D spending, at over $20 billion. Duke Energy Corp. leads all companies with $36 billion of planned T&D spending through 2027 and has an aggressive solar pipeline topping 4.6 GW.
Other utilities with at least 1,000 MW of renewable capacity in development and over $1 billion in planned transmission spending include Eversource Energy, Southern California Edison Co. parent Edison International, Avangrid Inc., CenterPoint Energy Inc. and Xcel Energy Inc.
The energy industry is well aware of the transmission constraints issue, as evidenced by the billions of dollars being poured into expanding and upgrading the grid. With curtailment and congestion costs rising across much of the country and hundreds of renewable projects awaiting interconnection, however, the question is whether these upgrades will happen quickly enough to keep pace with the increasing penetration of wind, solar and energy storage.
Data visualization by Allen Villanueva.
For wholesale prices and supply and demand projections, see the S&P Global Market Intelligence Power Forecast.
Tanya Peevey, Steve Piper and Ciaralou Palicpic contributed to this article.
This article was published by S&P Global Market Intelligence and not by S&P Global Ratings, which is a separately managed division of S&P Global.
