


Research — 5 Sep, 2024
Commercial real estate maturity wall $950B in 2024, peaks in 2027

By Thomas Mason
Rate hikes by the Federal Reserve and changes in post-pandemic behavior have put pressure on commercial real estate (CRE) borrowers needing to refinance loans coming due. The tally is nothing to sneeze at, with approximately $950 billion in CRE mortgages set to mature in 2024, according to S&P Global Market Intelligence's analysis of nationwide property records.
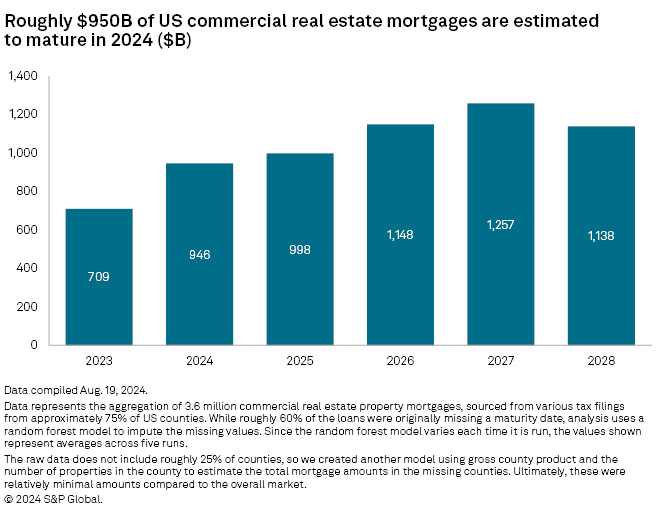
Should borrowers fail to seek the necessary refinancing and default on their loans, banks would not only face losses on their loans but valuations in the CRE market could come under significant pressure. Origination data shows that maturity wall will grow to nearly $1 trillion in 2025 and ultimately peak in 2027 at $1.26 trillion, suggesting that the issue is unlikely to resolve soon.

The Federal Reserve's interest rate hikes since March 2022 have put pressure on borrowers that need to refinance CRE loans coming due. To measure the potential interest rate shock for borrowers, we looked at the average interest rate on CRE loans originated in 2024, 6.2%, versus the rate on mortgages maturing, 4.3%, a jump of nearly 200 basis points.
Should borrowers default on loans, it would not only lead to losses for lenders but could add downward pressure on CRE prices. Based on our estimates, we expect approximately $950 billion of CRE mortgages to mature in 2024, and higher totals in the four years after that. In the next five years, we expect the amount to peak in 2027 at $1.26 trillion.
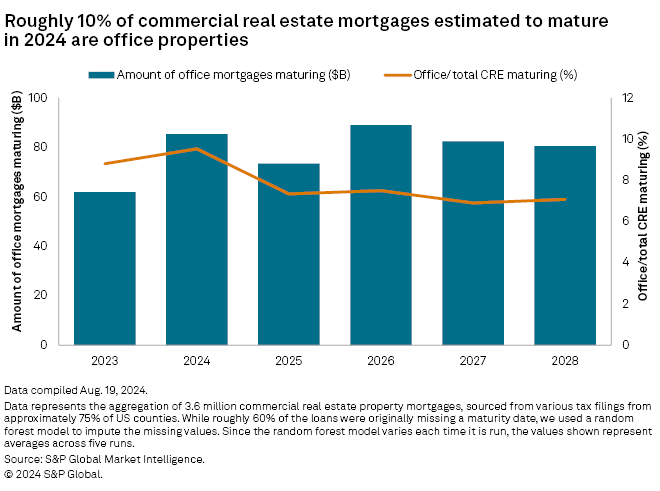
Of the different CRE categories, the office sector is being closely watched, as the shift to more employees working remotely post-pandemic has led to elevated vacancies and delinquencies in that space. Approximately 10% of the CRE mortgages maturing in 2024 are office properties, based on our analysis, which is higher than in 2023. But, on the bright side for lenders, we expect the ratio to decline in subsequent years.

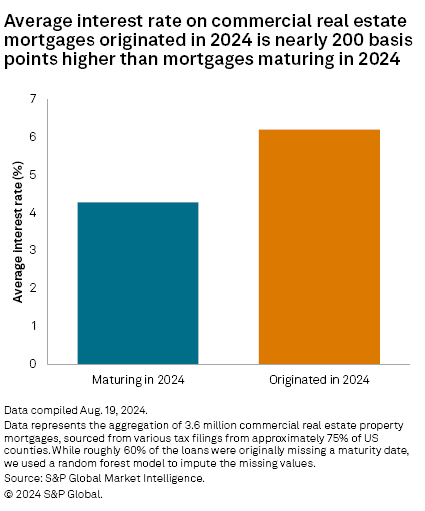
Any borrower seeking refinancing at current rates would face a rate shock. As of Aug. 19, the average interest rate on CRE loans originated in 2024 was 6.2%, whereas the rate on those maturing was 4.3%, a jump of nearly 200 basis points.
We constructed the maturity wall using S&P Global's Commercial Prospecting database. One of the main hurdles to using the CRE mortgage data, which comes from CoreLogic, was that roughly 60% of the mortgage records were missing a maturity date. To remedy this, we fed the characteristics of the loans — size, interest rate, type of loan, etc. — to a "random forest" regression model to fill in the gaps with estimates using records for which we do have a maturity date.
Our maturity wall results are broadly consistent with estimates from The Mortgage Bankers Association. In February 2024, the industry trade group estimated $929 billion of outstanding commercial mortgages held by lenders and investors would mature in 2024, a 28% increase from $729 billion in 2023, based on survey data. With the data and model we used, however, one can drill down to the loan level to examine specific properties, regions, lenders, etc.
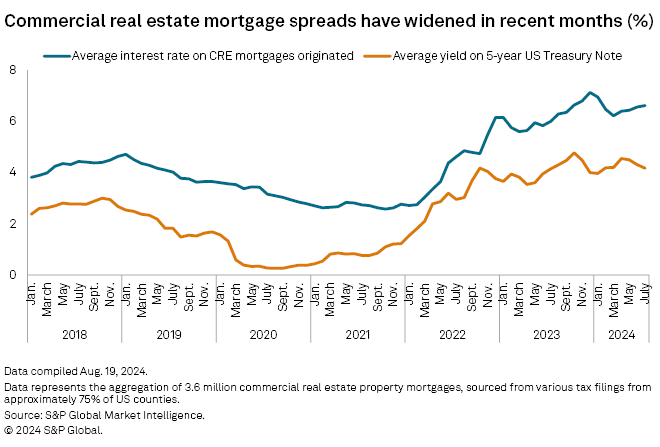
If the Federal Reserve lowers interest rates at its September meeting, the action could offer some relief to borrowers. The latest Fed minutes, released Aug. 21, suggested a rate cut of 25 basis points was potentially in the cards at its July 30–31 meeting, and "the vast majority observed that, if the data continued to come in about as expected, it would likely be appropriate to ease policy at the next meeting." But a return to pre-pandemic CRE interest rates — roughly 3.6% on average in February 2020 when the fed funds rate was at 1.6% — seems unlikely in the near-term.
Of the different CRE categories, the office sector is being closely watched, as the shift to more employees working remotely post-pandemic has led to elevated vacancies and delinquencies in that space. Concerns over the office real estate sector remain high, particularly for older buildings where few employees have returned to the office. High interest rates, low valuations and increased scrutiny of the sector will prove worrisome for the coming quarters, as landlords find it challenging to refinance their loans in the current environment.
Approximately 10% of the CRE mortgages maturing in 2024 are office properties, based on our analysis, which is higher than in 2023. But, on the bright side for lenders, we expect the ratio to decline in subsequent years. Many of the largest lenders in the US office market have been dialing back their exposure; in the second quarter, Wells Fargo & Co. and Bank of America Corp. reported declines of 1.5% and 6.5%, respectively, in their outstanding office exposure balances, per an S&P Global Market Intelligence analysis published Aug. 5. Banks have also prepared for tough sledding ahead, holding loan-loss reserves at high-single digits for loans tied to office properties, and tout that they have low loan-to-values on their office credits, giving them significant equity cushions.
The US banking industry has already seen some decline in CRE credit quality. The quarterly delinquency rate on CRE loans (excluding owner-occupied loans) has risen since the third quarter of 2022, coming in at 1.4% in the second quarter of 2024. But the second-quarter 2024 delinquency rate is very low compared to the Great Recession; in 2009, amid the subprime mortgage crisis, delinquencies accounted for 10.2% of total CRE loans.
Credit quality has varied across subcategories in the CRE market as well. In general, delinquencies on owner-occupied CRE loans have only increased modestly, while delinquencies on non-owner-occupied loans have risen much more. But performance has diverged between larger banks and community banks. The increase in delinquencies has been most pronounced at banks with more than $100 billion in assets, which have the balance sheet capacity to lend against high-rise office properties in center city areas that have garnered the most negative attention in the post-pandemic era.
Overall, S&P Global expects additional credit deterioration in the remainder of 2024 and 2025, per an industry forecast published in July, but the outlook is not excessively bearish. Net charge-offs should rise from relatively benign levels, but such losses, and the reserves required to fund them, will likely only result in a modest hit to earnings, according to the report.
Methodology
The random forest model, which estimates the life of each loan in years, had an r-squared of 0.65 and a mean-squared error of 53 years. Given that the test set was roughly 31,900 loans, we think a mean squared error of only 53 is a very favorable result and, therefore, our model offers suitable approximations of the actual mortgage lengths. The distributions of the actual and estimated data sets looked similar as well, another encouraging sign. The random forest model's accuracy was better than a variety of other models we tried: linear regression, decision tree regression, a boosting ensemble method and a neural network.
The raw data does not include roughly 25% of counties, but those counties tended to be small; as of Jan. 1, 2024, they accounted for only 3.5% of all US gross county product. We created another model using gross county product and the number of properties in the county to estimate the total mortgage amounts in the missing counties. These were relatively minimal amounts compared to the overall market.
The Workbench notebook accompanying this article automates the process of calculating the CRE maturity wall, including the random forest model used to impute missing maturity dates. It pulls S&P Global Market Intelligence's data on CRE loans, the banking industry and economic indicators — which are located in different databases — into one location and provides downloadable visualizations of the data. Click here for a webinar showing how to use S&P Global's data feeds in applications like Workbench and Power BI.
Listen onApple Podcasts and Spotify.
"Street Talk" is a podcast hosted by S&P Global Market Intelligence. In the episode, S&P Global Market Intelligence analysts Tom Mason, Chris Hudgins and Zain Tariq, discuss the threat of maturing CRE mortgages. The trio also outlined differences in valuations across different CRE categories, the potential read through provided by the publicly traded REIT sector and how banks are managing their CRE exposures and reacting to regulatory and investor scrutiny into the asset class.
This article was published by S&P Global Market Intelligence and not by S&P Global Ratings, which is a separately managed division of S&P Global.