S&P Global Offerings
Featured Topics
Featured Products
Events
S&P Global Offerings
Featured Topics
Featured Products
Events
S&P Global Offerings
Featured Topics
Featured Products
Events
Banking & Capital Markets
Economy & Finance
Energy Transition & Sustainability
Technology & Innovation
Podcasts & Newsletters
Banking & Capital Markets
Economy & Finance
Energy Transition & Sustainability
Technology & Innovation
Podcasts & Newsletters
S&P Global Offerings
Featured Topics
Featured Products
Events
Research — 10 Aug, 2022

By Keith Nissen
Introduction
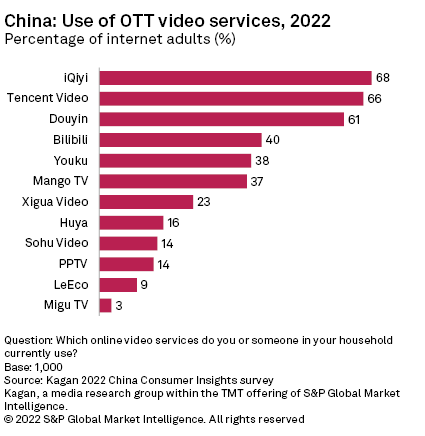
Two-thirds of internet adults in China use the iQiyi and Tencent Video services to watch online video, according to the Kagan 2022 China Consumer Insights survey. However, the survey also revealed that online video remains supplemental to live (linear) TV programming for most internet adults.

* Nine out of 10 internet adults watch online video; iQiyi and Tencent Video are the most popular subscription video-on-demand services.
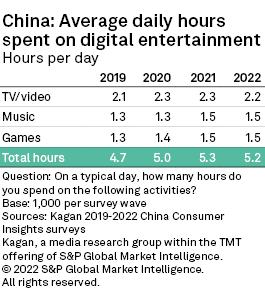
* On average, internet adults in China spend over five hours per day on digital entertainment. Approximately two hours per day is spent watching TV/video content.
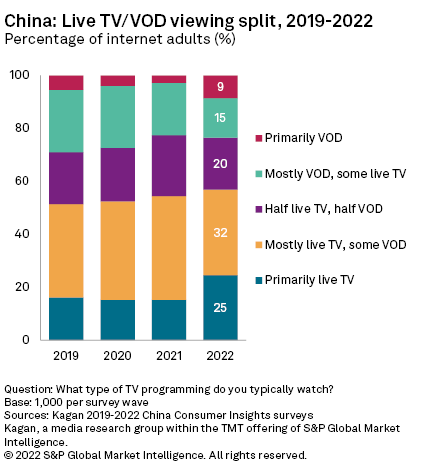
* Survey data indicates that live (linear) TV-centric viewers are watching more live TV in 2022 than in previous years, while VOD-centric viewers are watching more on-demand video this year than in the past.
* TV series programming and short-form video are the most popular types of video content viewed on smartphones. Over half of internet adults said they spend more time in front of the big-screen TV watching live (linear) TV than any other type of video content.

Results from the Kagan 2022 China Consumer Insights survey, completed in June 2022, show that 92% of internet adults watch paid or free online video. Over two-thirds (68%) of internet adults said they use iQiyi, owned by online search engine giant Baidu, followed closely by 66% using Tencent Video. Douyin, the Chinese version of TikTok, is also extremely popular with six out of 10 (61%) internet adults using the service. Bilibili is a video-sharing website, and Youku is an online video service owned by e-commerce giant Alibaba. Mango TV is an online video service operated by the Hunan Broadcasting System.
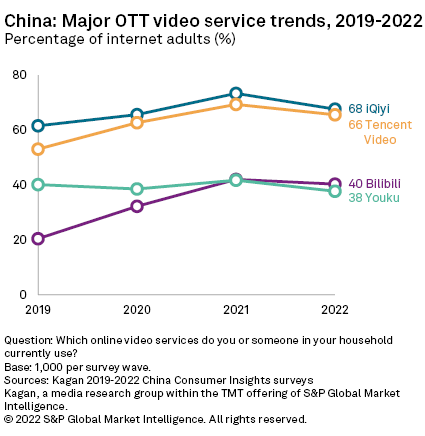
Historical survey data depicts strong user growth for iQiyi, Tencent Video and Bilibili between 2019 and 2021. IQiyi and Tencent Video use peaked in 2021 at 73% and 69%, respectively. The use of Bilibili grew a whopping 20 percentage points over the same time period, matching that of Youku at 42% in 2021. All four online video services saw a modest decline in usage in 2022.
Overall use of digital entertainment in China has followed the same pattern as that of the major over-the-top video services, exhibiting strong growth from 2019-2021, followed by a slight decline in 2022. On average, internet adults in China spend over five hours each day on digital entertainment, which includes over two hours per day watching TV/video content. Internet adults also report spending another 1.5 hours per day, on average, listening to music, as well as playing video games. The 2022 survey found that 82% of internet adults play mobile video games, 78% play online/console games and 63% listen to online music.
Over the past four years, the percentage of internet adults subscribing to a multichannel TV service has declined 10 percentage points to 69% in 2022. However, this decline is predominantly from an increase in the number of young adults choosing not to subscribe (video cord nevers) rather than those dropping their pay TV subscription (video cord cutters).
Historically, over half of internet adults in China have reported watching primarily or mostly live (linear) TV programming, with some on-demand video. In 2022, the survey data showed a 10 percentage point increase among those watching primarily live TV (25%), while those watching mostly live TV with some VOD declined 7 percentage points year over year. Similarly, those watching primarily VOD increased 6 percentage points year over year to 9%, while internet adults who watch mostly VOD with some live TV programming dropped 5 percentage points to 15%. This suggests that existing TV viewing preferences (live TV-centric or VOD-centric viewing) are being reinforced, rather than shifting over time.
The 2022 survey found that 36% of average daily TV/video viewing is spent watching on a smartphone, compared to 34% being spent in front of a big-screen TV. Only 20% of average daily TV/video viewing is conducted on the PC, with 11% on a tablet.
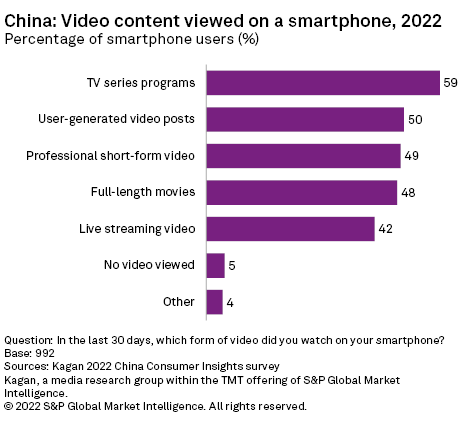
Six in 10 smartphone users (59%) reported watching TV series programs on the device over the past 30 days. Approximately half of smartphone owners said they have used their mobile devices to watch user-generated video posts (50%) and professional short-form videos (49%). Somewhat surprisingly, 48% indicated they have watched a full-length movie on their smartphone over the past month.
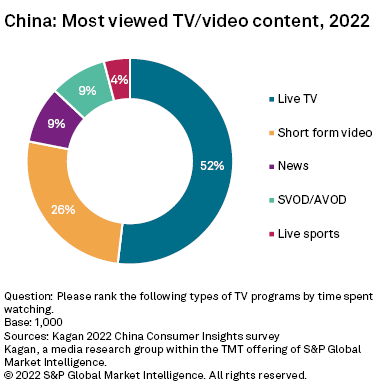
At home, live TV programming tends to dominate TV/video viewing. When asked to rank content types by time spent viewing, 52% of internet adults indicated they spend more time watching live TV than any other video content types. One-quarter (26%) of internet adults said they spend the most time watching short-form video, and 9% spend the most time watching news programs. The fact that just 9% said they spend the most time watching paid or free (SVOD/ad-based video on demand) online video services is further evidence that for most internet adults, online video is supplemental to live (linear) TV entertainment.
The 2022 Kagan China Consumer Insights survey, conducted in June 2022, consisted of 1,000 adults. The survey has a margin of error of +/-3 percentage points at the 95% confidence level. Percentages are rounded up to the nearest whole number.
Consumer Insights is a regular feature from Kagan, a media research group within S&P Global Market Intelligence's TMT offering, providing exclusive research and commentary.
This article was published by S&P Global Market Intelligence and not by S&P Global Ratings, which is a separately managed division of S&P Global.
