


Research — 18 May, 2022
Assessing wind speeds, potential performance across Atlantic offshore portfolio
By Tanya Peevey and Tony Lenoir
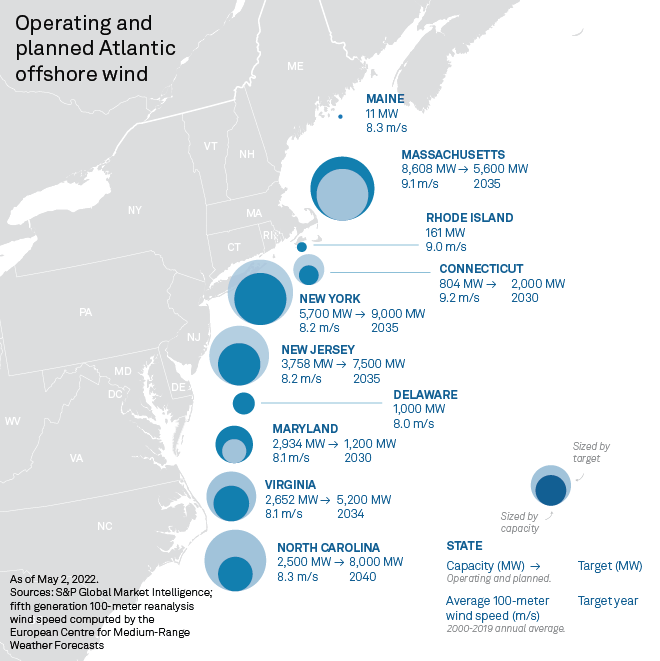
With 28 GW in planned offshore wind, 10 states across the U.S. East Coast are capitalizing on robust wind conditions along the nation's northernmost Atlantic shore, where average wind speeds hover at about 9 meters per second, pursuing optimal performance as the U.S. target for CO2 emission reduction by 2030 increasingly looms large. Atlantic offshore wind developments are a key component to achieving the U.S. Energy Department's target of 30 GW of offshore wind by 2030.

* Average wind speeds along the Atlantic offshore wind portfolio range from about 7.4 meters per second, or m/s, to 9.3 m/s, with most of the offshore projects expected to be breezy, at 8.0 m/s or greater.
* The fastest average offshore wind speeds are found in ISO-New England, about 1 m/s faster than in PJM, equating to potentially 10%-15% higher capacity factors for the region.
* Massachusetts and Maryland have planned capacity exceeding their targets, with Massachusetts hosting 30% of the 28 GW of planned Atlantic offshore capacity.

Facilitated by favorable seabed topography, a general trend of decreasing development costs, federal support and aggressive state renewable energy requirements, the Atlantic offshore wind pipeline boasts 28 GW of projects expected to be added to the 41 MW already operating off the coast of Rhode Island and Virginia, satisfying 93% of the DOE's target of 30 GW by 2030.
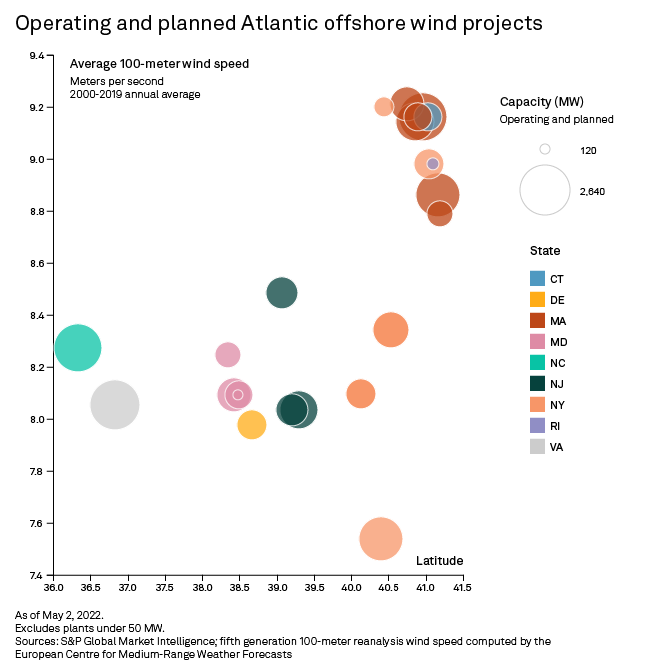
An S&P Global Commodity Insights analysis of 20-year average wind speed data from the European Centre for Medium-Range Weather Forecasts shows that wind speeds across the Atlantic offshore wind portfolio tend to increase with latitude/state with little variability across projects. New York is an exception. Planned offshore wind projects for the Empire State vary significantly in their longitudinal location. The Boardwalk Offshore Wind (Empire Wind) (Rockaway Peninsula) has a 20-year average wind speed of 7.5 m/s compared to the NY4 Excelsior Offshore Wind Park 140 miles to the east with average winds of 9.2 m/s.
For wind projects, performance is highly correlated with local climatology. A turbine's power output is proportional to the cube of the wind speeds at play. Specifically, a 1 m/s increase in average wind speed from 7 m/s to 8 m/s can produce an approximate 40% change in the power output using Vestas Wind Systems' V164-8.0 MW offshore wind turbine as a reference, as well as an estimated 10%-15% potential change in the capacity factor according to industry studies. Projects slated for the New York ISO are expected to have the largest capacity factor variability, ranging from 20% to 30%.
Within the Atlantic offshore wind portfolio, the highest offshore wind speeds are largely observed off the coast of ISO New England states. Most of the planned projects are expected to experience average wind speed greater than 9 m/s. The fastest wind speeds of about 9.2 m/s are found farther from the coast where six developers are active: Copenhagen Infrastructure Partners K/S, Equinor ASA, Iberdrola SA, BP PLC, EDP - Energias de Portugal SA and Shell PLC. The slowest wind speeds of 8.3 m/s are off the coast of Maine where the New England Aqua Ventus I Offshore Project (Maine Aqua Ventus I) is in development, with a planned capacity of 11 MW.
In the PJM Interconnection LLC, projects are at lower latitudes, farther from the average location of the faster moving polar jet stream, experiencing slower-than-average annual wind speeds of about 8 m/s from 2000 to 2019. Comparing these two independent system operators, the 1 m/s higher average wind speeds in ISO-NE could result in a 10%-15% higher capacity factor and more offshore wind capacity available to the grid.
Block Island Offshore Wind, currently operational, has an average wind speed of a breezy 8.9 m/s. The Coastal Virginia Offshore Wind (Virginia Offshore Wind Technology Advancement Project) owned by Dominion Energy Inc. has 12 MW of operational capacity in an area with an average wind speed of 8.2 m/s.
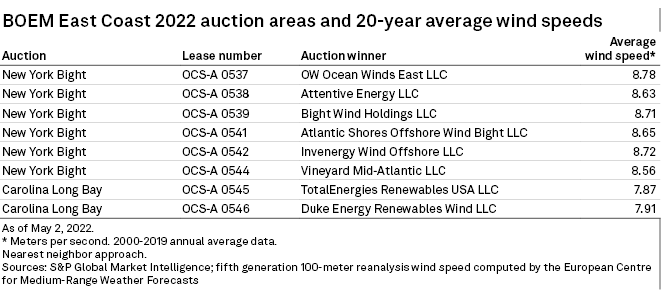
The winners of the Feb. 23-25 New York Bight auction could see average wind speeds ranging from about 8.5 m/s to 8.8 m/s based on our analysis of wind speeds in the area. Higher wind speeds and capacity factors are found in offshore lease area OCS-A 0542 won by Invenergy Wind Offshore LLC backed by Invenergy LLC and lease area OCS-A 0537 won by OW Ocean Winds East LLC, created in partnership between EDP subsidiary EDP Renewables North America LLC and Engie SA
Duke Energy Corp. and TotalEnergies SE won the most recent auction, held May 11, for two lease areas off the southern coast of North Carolina. Twenty-year wind speed in the Carolina Long Bay area averages about 7.9 m/s, lowest next to the Boardwalk Offshore project jointly owned by Equinor ASA and BP. This was the last auction before the July 1, 2022, 10-year moratorium.
From the current capacity, 29 MW are generated by the Block Island Offshore Wind project, owned by Danish power company Ørsted A/S. The remainder is operated by Dominion Energy via the company's Coastal Virginia Offshore Wind project. Dominion Energy is planning an additional 2.6 GW of offshore wind capacity for the state of Virginia.
With 3.3 GW in the pipeline spread across ISO-NE, NYISO and PJM, Ørsted A/S leads the pack across the U.S.'s planned Atlantic offshore portfolio. The Ørsted Ocean Wind 2 Offshore Farm project will bring 1.2 GW of capacity to New Jersey, significantly contributing to the state's 7.5-GW target by 2035. Three Ørsted projects — Revolution Wind Offshore, Sunrise Wind Offshore Farm and Deepwater Offshore Wind Energy Center (South Fork Wind Farm) — are joint ventures with Eversource Energy. The Massachusetts-based utility holding company is initiating a strategic review of its portfolio, which could result in a partial or full sale of its 50% stake in these projects.
Ørsted A/S's planned additional capacity extends from the mid-Atlantic to New England, with a little under half of the total in PJM.
PJM's planned capacity is spread relatively evenly amongst its five coastal and populous states: New Jersey, Delaware, Maryland, Virginia and the northeastern section of North Carolina covered by Dominion Energy. In ISO-NE, Massachusetts is to host about 90% of the 9.6 GW in planned capacity across the region. Two projects, 2.0 GW Bay State Offshore Wind and 1.5 GW Commonwealth Offshore Wind Project, account for the lion's share of the Bay State's offshore pipeline.
Planned offshore wind capacity off the coast of Massachusetts puts the state well ahead of its 5.6-GW offshore wind target by 2035, with about 7 GW of the 8.6 GW of planned capacity staying in Massachusetts. With 2.8 GW in the works, Maryland is on pace to exceed its offshore target — 1.2 GW by 2030. Second to the 8.6 GW of capacity being added off the coast of Massachusetts is the 8.2 GW of capacity for New York with its aggressive renewable energy policy. This includes the 5.7 GW off the coast of New York and an additional 2.5 GW allocated through power purchase agreements with wind projects off the coast of Massachusetts and Rhode Island. Notable projects include Beacon Offshore Wind Project and Boardwalk Offshore Wind projects with 2.4 GW and 2.0 GW of planned capacity, respectively.
Unveiled in a White House press release March 29, 2021, the DOE's offshore wind target is a key component in achieving U.S. economy-wide net-zero carbon emissions by 2050 — a renewed goal following President Joe Biden's Jan. 20, 2021, decision to rejoin the Paris Climate Agreement, originally signed Dec. 12, 2015. Following the move, the White House set a target to achieve a 50%-52% reduction in CO2 emissions from 2005 levels by 2030, ultimately aiming for net-zero emissions by 2050.
S&P Global Commodity Insights provides content for distribution on Capital IQ Pro.
For wholesale prices and supply and demand projections, see the S&P Global Market Intelligence Power Forecast.
Kristin Larson contributed to this article.
This article was published by S&P Global Market Intelligence and not by S&P Global Ratings, which is a separately managed division of S&P Global.