S&P Global Offerings
Featured Topics
Featured Products
Events
S&P Global Offerings
Featured Topics
Featured Products
Events
S&P Global Offerings
Featured Topics
Featured Products
Events
Banking & Capital Markets
Economy & Finance
Energy Transition & Sustainability
Technology & Innovation
Podcasts & Newsletters
Banking & Capital Markets
Economy & Finance
Energy Transition & Sustainability
Technology & Innovation
Podcasts & Newsletters
S&P Global Offerings
Featured Topics
Featured Products
Events
18 Aug, 2021

By Eric Oak
Global supply chains have been beset by cost inflation since late 2020, with a wide range of commodities continuing to experience rising prices. Panjiva's basket of seven industrial commodities (sourced from S&P Capital IQ) plus shipping rates increased 0.5% as of Aug. 13 versus June 30, following an 18.9% rise in average prices in the second quarter of 2021 versus the first quarter.
There has been a widely mixed performance, though. Prices for lumber and crude oil fell 32.1% and 4.4%, respectively, on Aug. 13 versus June 30, while cotton and shipping rates rose 9.9% and 14.9%, respectively.
The rise in shipping rates may prove particularly persistent on the strength of commentary from container lines and freight forwarders, as discussed in Panjiva's research of Aug. 18, almost all of whom expect rates to remain elevated at least until the first quarter of 2022.
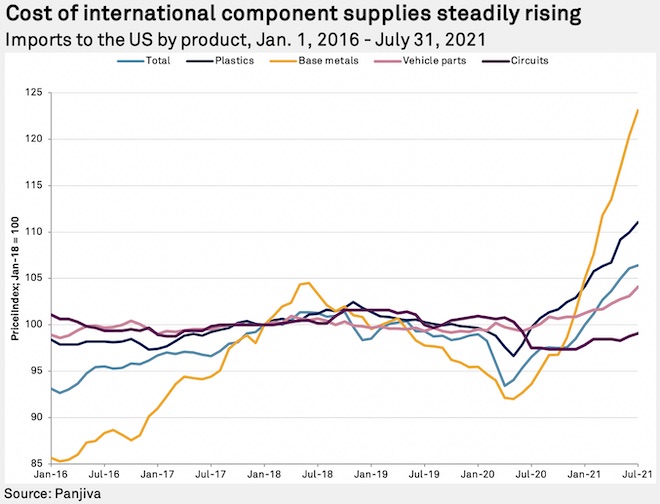
The global transfer of higher prices has been underway since mid-2020 on the basis of U.S. import price inflation data. Panjiva's analysis of official figures shows aggregate import prices increased 0.3% in July versus June — the ninth consecutive rise and the 14th in the past 15 months.
Importantly, much of the inflation has come through in key supply chain components. Prices for plastics and base metals increased 1.0% and 2.3%, respectively, in July and have risen 14.0% and 29.5%, respectively, since May 2020. Vehicle parts and computer circuits also increased 1.0% and 0.3%, respectively, from June to July, potentially reflecting the global shortage of semiconductors.

The transmission of higher commodity, component and assembled goods costs into consumer prices can take several months. That may not take as long as the two to three quarters highlighted in the coffee industry, but a bow wave of higher prices could take a few months to fully feed through into consumer prices.
Indeed, there are already clear signs of higher commodity and import prices feeding into producer prices. Intermediate stage 4 producer prices rose 1.1% in July versus June and have increased 15.8% since May 2020, while final core goods producer prices rose 0.6% in July versus June and by 13.5% since May 2020.
On an annualized basis, that has meant import prices rose 10.2% and final goods producer price index increased 10.4%, while consumer prices rose 5.4% year over year in July as companies begin to pass through higher costs.
All companies are becoming more focused on inflation, particularly the information technology and consumer discretionary sectors, whose mentions of inflation in earnings calls jumped 98.1% and 90.0% year over year, respectively, in the second quarter of 2021. Information technology talk about inflation increased further in July to 186.7% from 90.0% last year, while consumer discretionary growth on the topic slowed to 60.0% from 90.0% in the same period. Both sectors sell relatively more elastic goods than those with lower growth rates like communications and utilities, making inflation a more prominent threat to potential operations.
Sentiment data accessed through S&P Global Market Intelligence Xpressfeed shows the opposite is true, with sentiment in financial calls increasing 386.7% year over year in July. Markets that will likely be able to benefit from raised prices or those that can easily raise prices, like energy or real estate, show higher sentiment growth, while sectors that may have greater negative impacts from wage growth and resistance to price increases, such as consumer goods, show slower sentiment growth. Notably, the information technology sector saw the lowest sentiment growth, up only 38.3% year over year in July and 18.8% in the first 15 days of August. This is likely due to the ongoing semiconductor shortage, combined with signs of satiated demand from the laptop market.
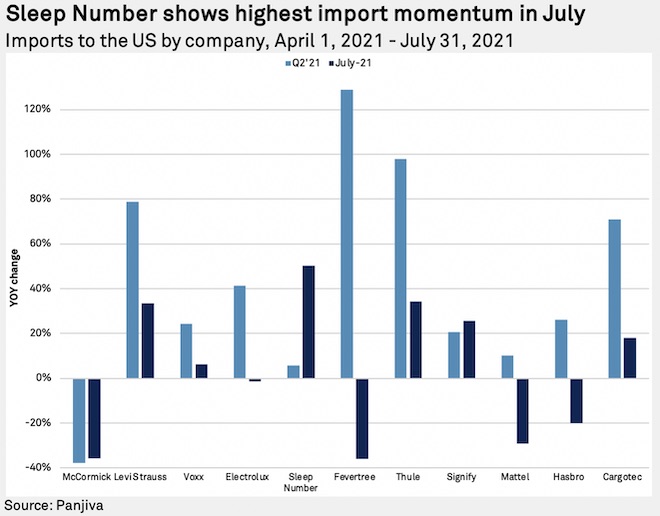
Panjiva data for companies in July provides a sneak peek into their third-quarter performance. One way to measure this is through import momentum, or the difference between the year-over-year change in imports in July versus the year-over-year change in imports in the second quarter.
Spice supplier McCormick & Co. Inc.'s CEO, Lawrence Kurzius, said during the company's second-quarter earnings call that they are "investing in our supply chain to expand our capacity and capabilities as well as increase our resiliency," and rearranging their supply chain. This may be slow coming as imports associated with the company continued to fall 35.7% year over year in July, a 2.2 percentage point increase from the second quarter.
Mattress manufacturer Sleep Number Corp. saw large import momentum, with imports in July rising 44.5 percentage points faster than in the second quarter. This likely indicates the company's supply chain has recovered from "temporary component and labor constraints, inflation and expedited logistics pressures" that occurred in June and July, according to CFO David Callen. Panjiva's research of July 22 notes that the next challenge for the company is likely to be "absorbing the inflationary impacts of a global supply chain."
Signify NV, a lighting company, also saw positive import momentum, with imports in July increasing 25.7% year over year against import growth of 20.7% in the second quarter. This indicates that the company is managing the "crazy bullwhip effect" mentioned on the firm's second-quarter earnings call successfully.
Levi Strauss & Co., VOXX International Corp., AB Electrolux, Fevertree Drinks PLC, Thule Group AB (publ), Mattel Inc., Hasbro Inc. and Cargotec Corp. all saw negative import momentum, possibly showing that the boom in imports associated with reopenings and vaccine optimism this year may be coming to a close. With another critical holiday season for retailers approaching, imports will likely need to recover in the third quarter.

Eric Oak is a researcher at Panjiva, a business line of S&P Global Market Intelligence, a division of S&P Global Inc. This content does not constitute investment advice, and the views and opinions expressed in this piece are those of the author and do not necessarily represent the views of S&P Global Market Intelligence. Links are current at the time of publication. S&P Global Market Intelligence is not responsible if those links are unavailable later.
The S&P Capital IQ Pro and S&P Capital IQ platforms are owned by S&P Global Market Intelligence.
