S&P Global Offerings
Featured Topics
Featured Products
Events
S&P Global Offerings
Featured Topics
Featured Products
Events
S&P Global Offerings
Featured Topics
Featured Products
Events
Banking & Capital Markets
Economy & Finance
Energy Transition & Sustainability
Technology & Innovation
Podcasts & Newsletters
Banking & Capital Markets
Economy & Finance
Energy Transition & Sustainability
Technology & Innovation
Podcasts & Newsletters
S&P Global Offerings
Featured Topics
Featured Products
Events
26 Feb, 2021
In the latest illustration of the frothy conditions in U.S. credit markets, investors in the $1.2 trillion leveraged loan asset class are increasingly venturing further down the capital structure in search of much-needed yield.
Second-lien loans, which are often associated with risk-on investor sentiment, are subordinated in the event of default — and recoveries — to first-lien tranches of the issuer's debt. In return, second-lien loans offer higher relative yields. But that yield has dwindled. While the volume of newly minted second-lien loans is almost on pace with 2018 — when earnings and the broader economy were much stronger — the reward in terms of spread over Libor is the tightest it has been since the Great Financial Crisis.
In a trend reversal, driving this strong showing of the $5.85 billion of second-lien credits issued through Feb. 21 this year has been the return of demand from the syndicated loan market. LCD data shows the volume of second-lien loans sold via a traditional syndications process has outpaced loans preplaced with private funds by nearly a 3:1 ratio. During the same period in 2020 and 2019, syndicated placements made up just 39% and 11% of second-lien issuance.
 |
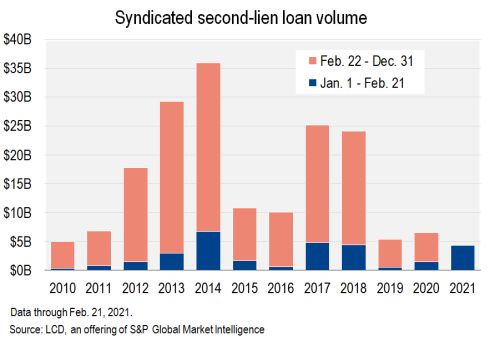
Looking at annual totals, second-lien loan volume has been in short supply since the wave of 2017 and 2018, when issuance levels were $25 billion and $24 billion, respectively.
 |
Investors in recent weeks have turned to ever-riskier offerings, funding loans from lower-rated borrowers and to companies funneling proceeds to private equity sponsors via dividend/recapitalization deals. Investors have also had to concede a surge of loan repricings, lowering the cost of funds for an issuer and the return for the lender.
With respect to second-lien issuance, Asurion’s second-lien refinancing, which at $1.65 billion is by far the largest this year, holds a B+/B1 corporate credit rating, meaning investors are taking subordination risk on a comparatively better-rated company in the speculative-grade space, compared to the broader supply coming from this part of the market. Single B-minus rated borrowers currently make up 56% of the remaining second-lien supply, with single-B flat accounting for just 7%.
Of course, the sample size of 13 deals in 2021 thus far is limited. But for historical comparison, during the 2017 and 2018 second-lien new-issue wave, 52% and 54% were courtesy B-minus issuers (so rated by at least one rating agency).
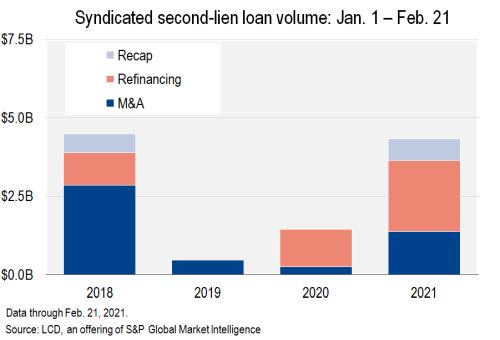
With loan spreads ever-tightening and dealmaking on the rise, M&A and refinancings are driving second-lien activity. M&A accounts for 32% ($1.4 billion), and refinancings for 52% ($2.3 billion) this year. In the 2018 second-lien wave, 72% of the full-year activity came from companies funding M&A.
 |
As mentioned, the syndicated volume of second-lien term loans nearly matches the pace from 2018, though spreads offered for holding these structures are 62 basis points narrower now than they were on the deals that cleared then. However, given the levels at which first-lien loans are clearing, and the collapse of yields in the high-yield bond market, investors are, unsurprisingly, becoming more receptive to this junior loan debt.
The 13 syndicated second-lien deals launched in 2021 have priced at an average spread of 716 bps over Libor, compared to an average new-issue spread of 380 bps over Libor for concurrent first-lien term loans. For the record, the spread over Libor for loans in the less-risky, first-lien portion of the capital structure has fallen from 400 bps at the end of 2020, and is now the lowest it has been since the Great Financial Crisis, according to LCD.
 |
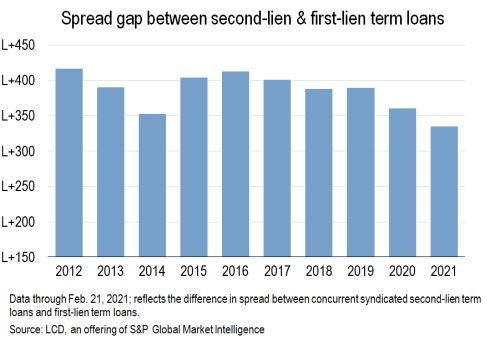
All told, the spread gap between concurrent second- and first-lien term loans has narrowed by 52 bps since the 2018 second-lien wave. Investors are now being compensated 335 bps to hold second-lien over first-lien loans, compared to 388 bps in 2018.
 |
For issuers, the option to call in the second-lien loan market can be attractive, compared to funding in the high-yield bond market. For investors, with the yield-to-worst on high-yield bonds in the secondary market collapsing to a record low of just 3.86% last week — per the S&P U.S. High Yield Corporate Bond Index — the appeal is clear.
Moreover, second-lien loans have a solid performance history for investors.
Consider both monthly and annual returns between first- and second-lien loans: The latter has typically moved more dramatically than the broader market. During the March 2020 plunge in the global financial markets, when riskiest assets were punished most severely, second-lien loans cratered by nearly 17%, compared to losses of 12% for first-lien loans. In the subsequent recovery, second-lien has outpaced first-lien in every month except for April.
 |
This pattern holds true historically. Since 2010, second-lien loans have significantly outperformed in all but three of the annual return periods. In 2015, the only year other than during the Great Financial Crisis to bring negative returns to leveraged loan investors, second-lien loans lost a staggering 7.5%, compared to a 0.35% loss for first-lien loans. A few distinctions can help to explain these outsized moves. For one, second-lien loans, in sitting further down the recovery waterfall in the event of default, are riskier and, by extension, more volatile.
 |
Second-lien loans also account for a much smaller share of the S&P/LSTA Leveraged Loan Index (2.6%, or $30.80 billion at the end of January), and with an average facility size of just $237 million at issuance, compared to $845 million for the index as a whole, tend to be much less liquid, and therefore subject to more volatile swings.
High sector concentrations also play a part. Until late 2016, Oil & Gas comprised 18% of outstanding second-lien loans. That share had fallen to 3.5% by the end of January 2021. Electronics (LCD's proxy for Technology) now make up a third of the second-lien market, at 33%, followed by Insurance at 10% and Business Equipment & Services at 8%.
As an aside, second-lien loans are almost exclusively issued by privately held companies, rather than public companies, meaning the information flow of financials and significant events might not be as transparent as with publicly traded companies. According to LCD, 95% of second-lien loans were issued by sponsored companies, compared to 64% in the wider index, based on facility count.
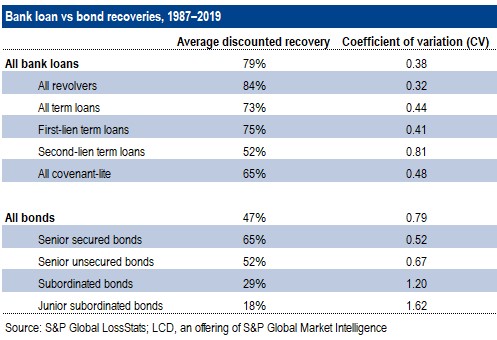
A final word on loss expectations for second-lien loans, over first-lien, in the event of default. Unsurprisingly, the waterfall of recoveries follows the pattern of seniority in priority of payment. LCD's study of leveraged loan recoveries from 1987 to 2019 finds an average recovery rate of 52% for second-lien loans. This compares to 75% for first-lien term loans, and 47% for bonds. In keeping with their small market size, second-lien term loans and bonds have a much higher standard deviation to the mean compared to first-lien term loans.
 |

