S&P Global Offerings
Featured Topics
Featured Products
Events
S&P Global Offerings
Featured Topics
Featured Products
Events
S&P Global Offerings
Featured Topics
Featured Products
Events
Banking & Capital Markets
Economy & Finance
Energy Transition & Sustainability
Technology & Innovation
Podcasts & Newsletters
Banking & Capital Markets
Economy & Finance
Energy Transition & Sustainability
Technology & Innovation
Podcasts & Newsletters
S&P Global Offerings
Featured Topics
Featured Products
Events
24 Jan, 2023
The largest S&P 500 stocks shed a greater share of value than their peers on the index during 2022's market downturn.
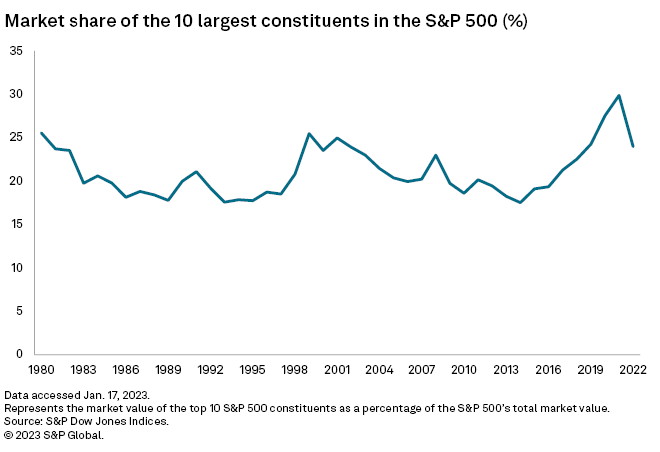
The 10 largest stocks in the index were worth a combined $7.986 trillion at the end of 2022, down 37% from 2021. The combined market value of all companies in the index fell about 20% during the year.
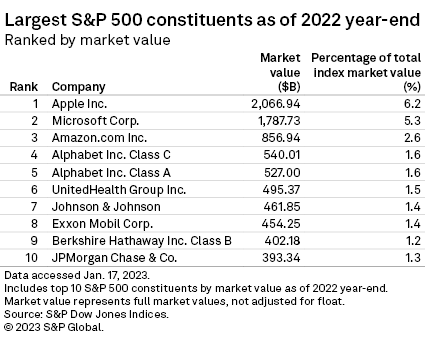
The 10 largest constituents of the S&P 500 — dominated by Big Tech players Apple Inc., Microsoft Corp., Alphabet Inc. and Amazon.com Inc. — accounted for 24% of the index's combined market capitalization in 2022, down from 29.9% in 2021, according to S&P Dow Jones Indices data.

Value erased
In 2022, the S&P 500 posted its worst annual performance since 2008, when the Great Recession tore into markets, as soaring inflation, rising interest rates and growing fears of a new recession in 2023 led to a decline in equities.
Apple, with $2.067 trillion in market value, was the S&P 500's largest constituent in 2022, making up 6.2% of the index's total market value at year-end. Apple, Microsoft and Amazon were the three largest S&P 500 constituents in both 2021 and 2022.

Meanwhile, Meta Platforms Inc., NVIDIA Corp. and Tesla Inc. all fell from the top 10 last year.
Tesla lost $674.6 billion, or 63.4%, of its market capitalization in 2022, while Meta lost $620.1 billion, or 66.3%, and NVIDIA lost $375.6 billion, or 51%, according to S&P Global Market Intelligence data.

Apple's negative 26.4% total return for the year was the largest contributing constituent for the S&P 500's low performance in 2022, in part due to it being the largest stock in the index.
Amazon and Tesla followed next, with returns of negative 49.6% and negative 65.0% for the year, respectively, followed by Microsoft's negative 28.0% return and Meta's return of negative 64.2%, according to data from S&P Dow Jones Indices.

Sector breakdown
Information technology stocks accounted for 25.7% of the index at year-end. While still the largest allocation, this also marked the biggest percentage shift from 2021, when IT represented 29.2% of the index.

Communication services made up 7.3% of the index in 2022, compared to 10.2% in 2021. The representation of consumer discretionary also fell, to 9.8% from 12.5%.
The energy sector's allocation nearly doubled over the past year, to 5.2% from 2.7%, while healthcare also increased to 15.8% from 13.3%.

