


28 Sep, 2021
Q4'21 Outlook: The logistics of seasonal cheer

By Eric Oak
The fourth quarter of 2021 will likely look different than the holiday seasons in previous years. This is largely due to the ongoing high-water mark of imports flowing into the U.S. since March. Total imports in March were the highest recorded, an unlikely time for volumes that normally peak in October. The levels reached in March, May and August of just over 3 million twenty-foot equivalent units, combined with freight rates and traffic outside of Los Angeles and Long Beach, Calif., suggest that imports are near their maximum monthly capacity. This is greater than the 2.9 million TEUs recorded in the 2020 peak last October but any company that has not adapted may get stuck in congestion.
Carriers reap the benefits of high demand
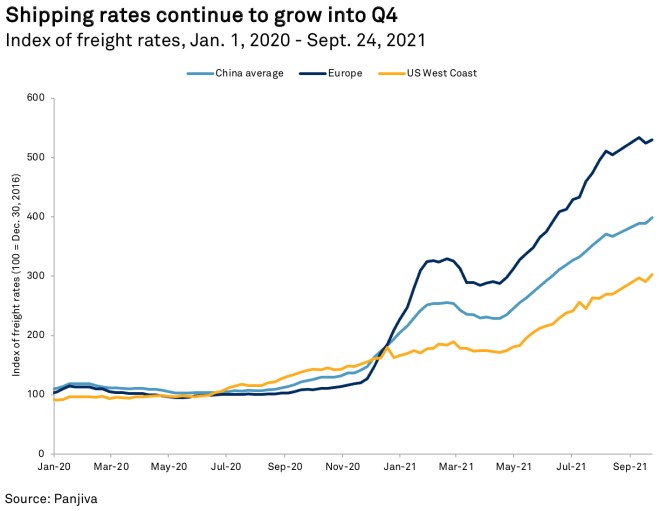
With demand for freight services outstripping supply, shipping rates have increased rapidly. The average price of container shipping out of China has increased 95.1% since Dec. 31, 2020, and continues to grow, increasing 10.4% since the end of July and 2.5% in the week to Sept. 24. Rates to the U.S. West Coast have increased slower than the average, up 83.0% since Dec. 31, 2020, but increased 15.3% since the end of July. On the other hand, imports to Europe have increased faster, up 134.0% since Dec. 31, 2020. These differences in regional pricing may reflect the relatively large capacity of the U.S. West Coast, as well as the potential of acute events like the Suez Canal blockage increasing spot rates.
High rates and high demand are great for logistics companies, who are likely as excited as retailers for a big holiday season. Carriers that stand the most to gain are ones who ship a greater proportion of goods in October, traditionally the peak month, rather than those that balance shipments across the year. A high proportion of shipments in October would indicate an ability to burst capacity, adding services when needed and backing off during the parts of the year that are usually slow.
The 2M Alliance seems to be the best at this, with members MSC Mediterranean Shipping Co. SA and ZIM Integrated Shipping Services Ltd. importing 11.9% and 12.0%, respectively, in October 2020, greater than the 11.0% baseline of imports that month. These proportions were likely boosted by the shipping slowdown during the COVID-19 pandemic but are equal to the next closest carrier, HMM Co. Ltd., with 11.9% of 2020 imports in October. One outlier was unaffiliated liner SM Line Corp., which had the highest proportion of October imports in 2019 at 10.2% but fell to 9.5% in 2020. This may indicate that the firm was impacted more than most by the pandemic, recovering slower during the peak season in 2020.
This has led to increased profits for logistics companies, with forwarders like C.H. Robinson Worldwide Inc. and Expeditors Inc. reporting EBITDA growth of 32.4% and 61.7% year over year, respectively, in the second quarter. FedEx Corp.'s EBITDA also increased 276.2% year over year, while liner Matson Inc. saw the same metric grow 205.6%. During the company's second-quarter earnings call, Matson CEO Matthew Cox said "the supply chain and supply-demand conditions to remain in place and lead to a high level of demand at least into Lunar New Year." This optimism is likely a large part of the growth in investment in new ships, ports and services, as discussed in Panjiva's research of Aug. 25. High shipping rates will likely keep profits high in the fourth quarter as holiday demand ramps up.

Firms react to a new normal
Corporations will likely have different reactions to the high costs, congestion and uncertainty that the pandemic and subsequent recovery have added to supply chains. One way that firms can address these concerns is through inventory strategy. Throughout much of the past decade, companies have focused on reducing inventories through strategies like just-in-time sourcing. This allows working capital efficiencies that can boost the performance of the business.
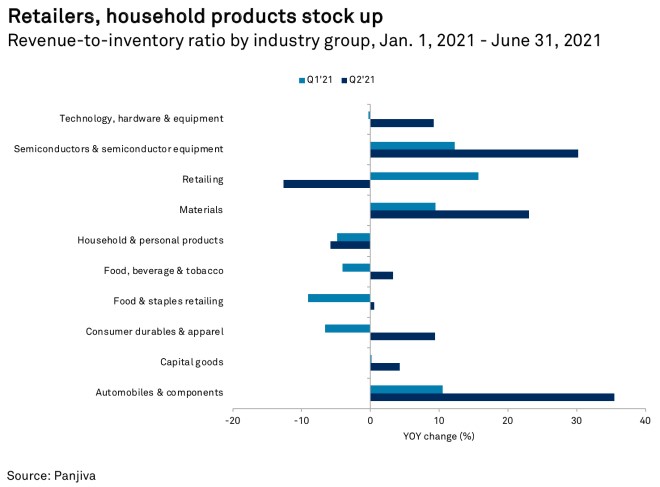
The risk, however, was seen during the pandemic as companies without suitable inventory reserves were more likely to have to pause manufacturing operations or other services. Stock-outs for retailers are also unwanted outcomes that can damage consumer reputation. Data comparing revenue with inventory levels across several industry groups shows that companies in the retail and household products sectors saw decreased ratios, falling 12.6% and 5.8% year over year, respectively.
This indicates higher inventories for each dollar of revenue. Other industry groups like materials and autos are operating leaner for each dollar of revenue, which also likely reflects the high demand for desired products. The revenue-over-inventory ratio for autos increased 35.5%, semiconductors by 30.2% and materials by 23.1%. These sectors have seen strong demand, with semiconductor shortages and rising material costs making news.
The talk about inflation is not unfounded as inflation, starting in raw materials, has worked its way through supply chains to intermediate products. The producer price index for chemicals, plastics and base metals have increased 0.7%, 0.9%, and 1.6%, respectively, from July to August. Goods further down the chain also saw increases start to creep in — apparel saw prices climb 0.3% and furniture saw a 0.1% month-on-month increase. Different supply chains interact with inflation at different speeds as companies pass costs to their customers and oppose price increases from their suppliers. This may hit consumers sooner if companies think their markets can bear higher prices during the upcoming holiday season.
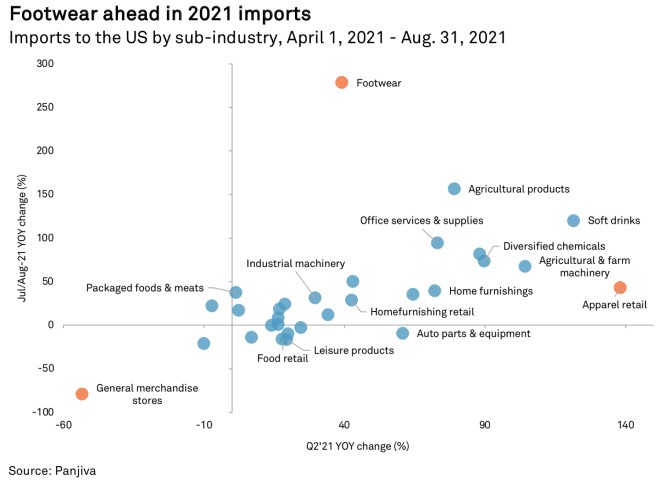
Panjiva data can show which sub-industries are ahead of holiday season imports in 2020. Footwear companies are seeing the largest increase in imports in July and August, up 278.0% after second-quarter 2021 imports rose 39.3% year over year. Footwear companies may be more flexible than most as labor is still a major cost component in that industry. For example, Steven Madden Ltd. CEO Edward Rosenfeld noted in August that they had "moved about half of the Steve Madden Women's production to Mexico and Brazil for fall" out of China. This is also likely a sign of early stock-up, or companies shipping earlier in anticipation of delays and congestion in logistics.
Apparel retailers like The TJX Companies Inc. may be facing more headwinds, however, with imports in July and August increasing 42.6% year over year after a 138.3% rise in the second quarter. TJX executives said in August they expected "freight, supply chain and wage costs to be higher" in the future. This could be due to pandemic-related pressure in Vietnam and other Southeast Asian countries as those nations work against a resurgence of the virus.
General merchandise stores may be the most at risk of a disappointing holiday season, with imports associated with those firms declining 53.2% year over year in the second quarter and by 79.3% year over year in July and August. This may be one of the challenges that BJ's Wholesale Club Holdings Inc. CEO Robert Eddy mentioned during the company's earnings call in August, when he said they "expect supply chain and sourcing challenges to continue for the foreseeable future." The diverse stock of these stores may make sourcing more difficult and they may not be able to prioritize a certain route or product category.
Eric Oak is a researcher at Panjiva, a business line of S&P Global Market Intelligence, a division of S&P Global Inc. This content does not constitute investment advice, and the views and opinions expressed in this piece are those of the author and do not necessarily represent the views of S&P Global Market Intelligence. Links are current at the time of publication. S&P Global Market Intelligence is not responsible if those links are unavailable later.