S&P Global Offerings
Featured Topics
Featured Products
Events
S&P Global Offerings
Featured Topics
Featured Products
Events
S&P Global Offerings
Featured Topics
Featured Products
Events
Banking & Capital Markets
Economy & Finance
Energy Transition & Sustainability
Technology & Innovation
Podcasts & Newsletters
Banking & Capital Markets
Economy & Finance
Energy Transition & Sustainability
Technology & Innovation
Podcasts & Newsletters
S&P Global Offerings
Featured Topics
Featured Products
Events
25 Mar, 2021
By Jonathan Hemingway
U.S. leveraged loan issuance rocketed in the first quarter of 2021 amid strong technical tailwinds as the specter of rising Treasury rates helped steer investors back toward floating-rate debt and as optimism grew around the COVID-19 vaccination rollout. The primary loan market bared the hallmarks of the risk-on environment, as opportunistic issuance metrics climbed to heights not seen in years.
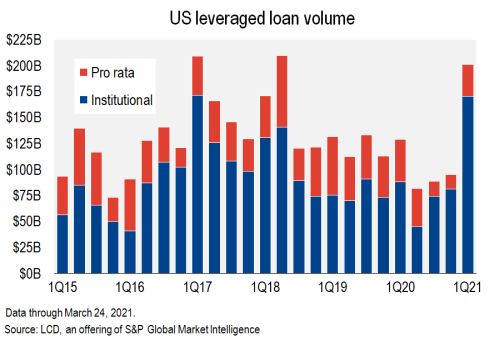 |
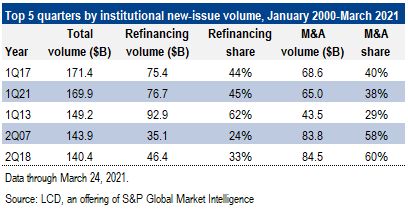
Institutional loan volume surged to $169.9 billion in the first quarter of 2021 through March 24. That was the second-highest quarterly volume of all time, within striking distance of the record $171.4 billion that the market absorbed in the first quarter of 2017, according to LCD. Indeed, through midday March 25, volume had nudged to $171.95 billion, for a new record (the following table shows data through March 24).
 |
On the demand side, loan issuance was supported by a heated CLO market and resurgent inflows into retail loan funds. CLOs, the largest consumer of leveraged loans, are off to a strong start in 2021 with total issuance surging to $36.1 billion through March 23, excluding refinancings and resets. It is the strongest start to a year since the Great Financial Crisis and the third-largest quarterly issuance in the CLO 2.0 era. At the same time, cash flows into loan mutual funds and exchange-traded funds swelled to roughly $12 billion in the first quarter (as of March 17), according to Lipper, to mark the largest upswell since the first quarter of 2017. These combine for $48.1 billion of total measurable demand during the period, the most since LCD began tracking this data 20 years ago.
 |
In addition, repayments stepped up as well, reaching $41.1 billion in February, a 12-month high, more than double the trailing-12-month average, at $18.4 billion. While some of the repayment total is due to refinancing with institutional loans, it also includes loan payoffs by other means, such as via M&A or funding in other markets.
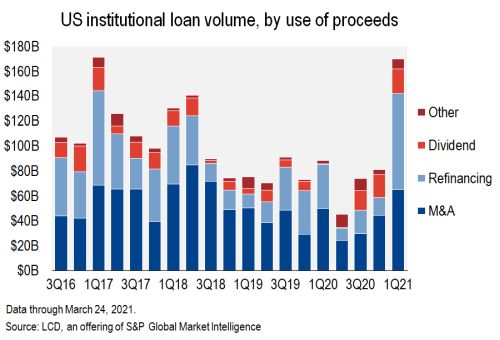
As issuers clamored to market to take advantage of the favorable conditions, refinancings took center stage. A total of $76.7 billion of loans were issued to refinance debt, or 45% of total supply in the quarter. That is the highest by dollar volume in eight years and the second-highest of all time (behind $92.9 billion in the first quarter of 2013).
 |
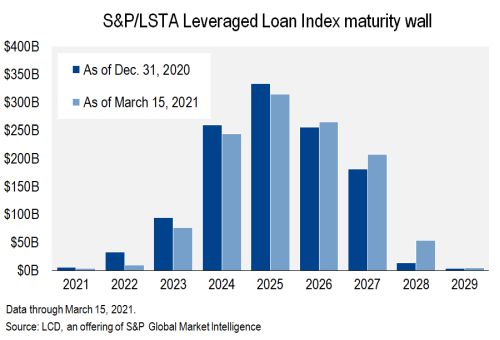
All that refinancing activity helped chip away at near-term maturities. Outstanding loans with maturities through 2025 declined by $77.9 billion over the past three months, while loans maturing in 2026-2029 increased by $76.6 billion.
 |
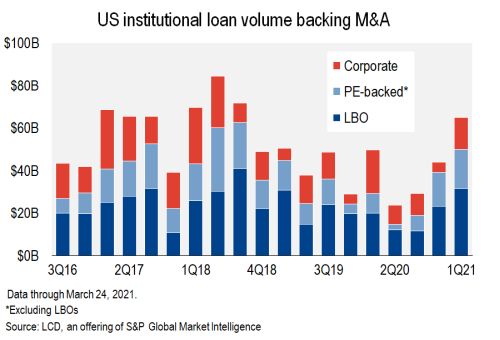
M&A and LBO issuance totaled $65 billion, a 31% gain over the comparable period a year ago, and the most issuance for this purpose since the third quarter of 2018. Drilling down, LBO volume alone hit a 2.5-year high of $31.7 billion, with some of the larger deals in the mix coming from RealPage Inc. ($2.75 billion), Triton Water Holdings Inc. ($2.55 billion), and Endure Digital ($2.4 billion). Aside from new LBOs, acquisition financing from private equity-backed companies added another $18.3 billion, also the highest since the third quarter of 2018, while deals backing M&A from issuers not owned by a private equity firm was at a four-quarter high of $15 billion.
 |
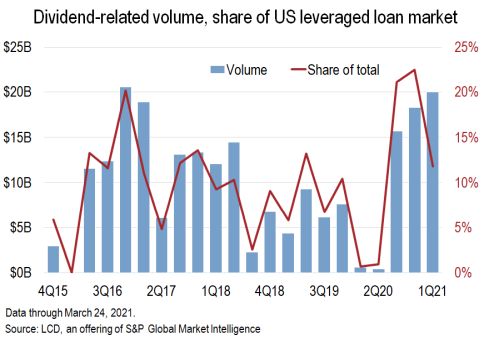
The hot start to 2021 in also opened the door for sponsor-backed companies to issue dividend deals. New-issue volume for companies that are owned by private equity firms shot to $17 billion, a four-year high. Dividend recapitalization volume was $13.4 billion in the third quarter of 2020, and it dipped slightly to $12.75 billion in the fourth quarter.
 |
Including nonsponsored issuers, dividend recapitalization volume was $20 billion, the highest reading since the fourth quarter of 2016.
 |
Repricings
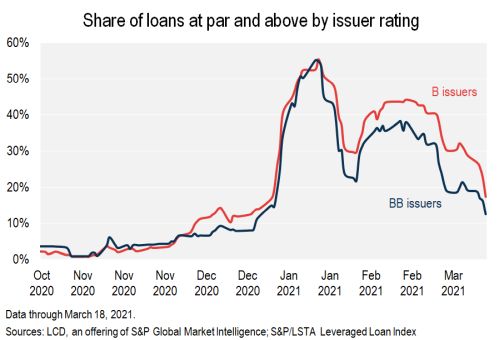 |
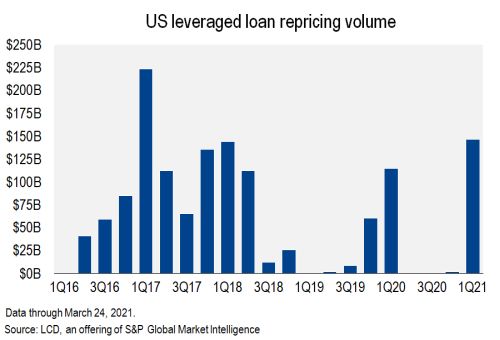
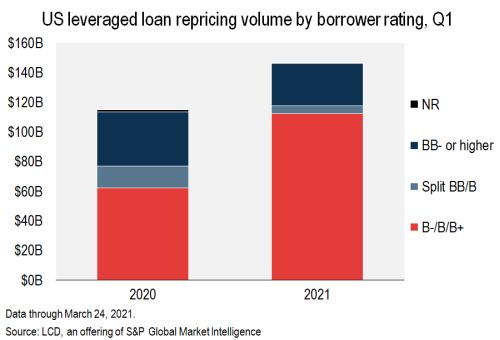
That incited a stampede of repricing transactions as issuers looked to lock in cheaper pricing on their existing loans. A total of $147 billion of institutional term loans were repriced during the quarter (through March 24), the most in four years (note that repricings do not count as new money transactions and are thus not included in new issue volume).
 |
Of that total, $112 billion, or 76% of the total, was for issuers with a single-B corporate credit rating. By contrast, 54% of repricings were out of the rating bracket in the first quarter of 2020, the last quarter that featured a significant repricing wave.
 |
Given the cost savings, it is easy to see why there was a rush to market. Consider that 42 tranches had pricing cut by at least 100 basis points across the spread and Libor floor, more than any other quarter since the first quarter of 2017. Of the 127 repricings launched in the first quarter, 42, or 33% of the total, were deals inked after the COVID-19 pandemic in 2020, from March onward, where the soft call protection rolled off (and in some cases where the 1% call premium was paid in order to reprice the loan). For the record, repricers from pre-March 2020 deals cut pricing by an average of 77 basis points, while repricings of deals that were issued in the higher-cost environment saved 90 bps.
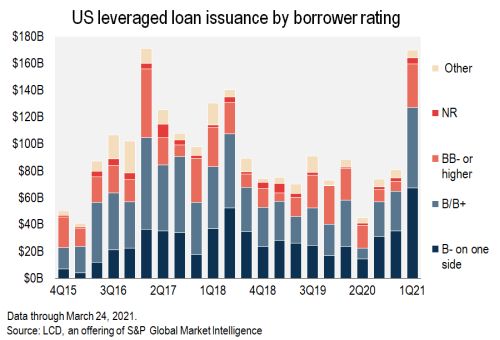
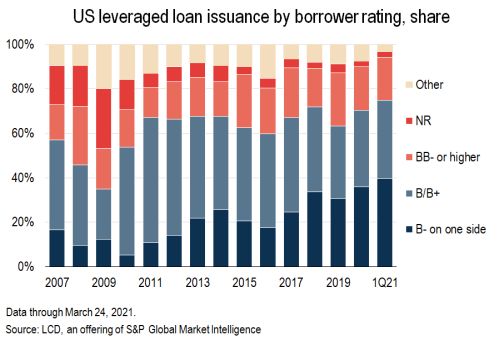
Further evidence of the supply-demand imbalance, and an indication of a rosier outlook of investors, was the growing comfort level for new issues from riskier, B-minus rated loan borrowers. Consider that a record-high $67.4 billion was issued in the first quarter from borrowers with a B- corporate rating on at least one side. That represents 40% of total issuance during the quarter. Note that for any full year the share of comparable B- issuance has never been above 36% (2020).
 |
Expanding the scope to the full single-B rating bucket, volume was again an all-time high at $127.1 billion, or 75% of total volume.
 |
At the same time, borrowing cost on these loans fell to the lowest level since the Great Financial Crisis. The new-issue yield to maturity on term loans — which takes into account the spread over Libor, three-month Libor (or the Libor floor) and original issue discount — to B-minus rated corporates dipped to 4.81% in January, the first time it had fallen below 5% in over 10 years, and held at 4.82% through February before rising to 5.43% in March. For reference, loans from B-minus borrowers that were launched to the syndications market last July cleared at 6.83%, although such activity remained light through the summer. The final four months of 2020 saw a pickup in B-minus borrowing, with new-issue yields averaging roughly 5.5%.
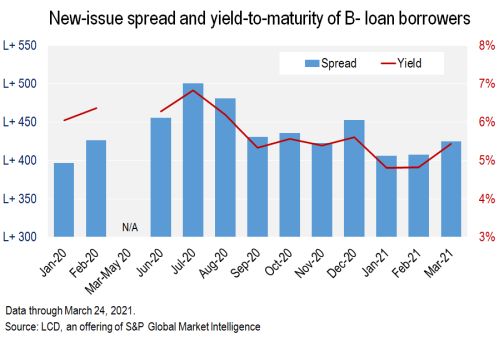 |
Looking at spread alone shows a similar pattern, with the average spread over Libor tightening to L+406 in January, just 10 basis points above the January 2020 reading (L+396) and 100 bps lower than in July. It had eased back to L+425 in March.
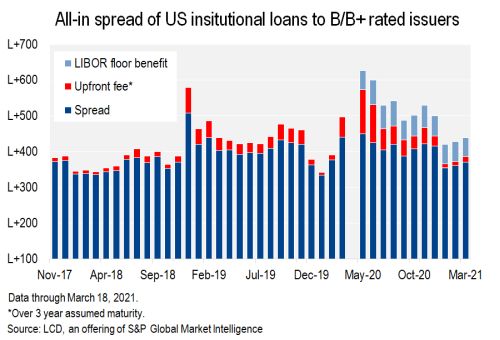 |
Similarly, new issue spread on deals from B/B+ rated issuers dropped to L+355 in January, the lowest level in a year, before widening out to L+370 on average in March. Average yield on these deals was 4.23% in January, the lowest level since the Great Financial Crisis, and rose 20 bps by March to 4.44%.
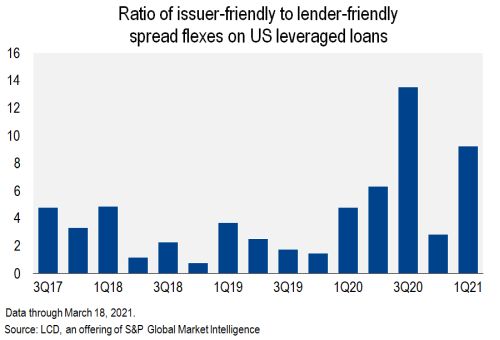 |
Of course, with most new issues being waved through the market, pricing flexes leaned heavily in the favor of issuers. The ratio of issuer-friendly to lender-friendly price flexes on spread was 9.2:1 in the first quarter. It is just the second-highest ratio since the Great Financial Crisis, behind the third quarter of 2020, when the ratio was 13.5:1.
