S&P Global Offerings
Featured Topics
Featured Products
Events
S&P Global Offerings
Featured Topics
Featured Products
Events
S&P Global Offerings
Featured Topics
Featured Products
Events
Banking & Capital Markets
Economy & Finance
Energy Transition & Sustainability
Technology & Innovation
Podcasts & Newsletters
Banking & Capital Markets
Economy & Finance
Energy Transition & Sustainability
Technology & Innovation
Podcasts & Newsletters
S&P Global Offerings
Featured Topics
Featured Products
Events
20 Jul, 2021

By Abby Latour
Large corporate buyouts in the second quarter of 2021 included the highest amount of institutional syndicated leveraged loan volume since the global financial crisis, LCD data shows.
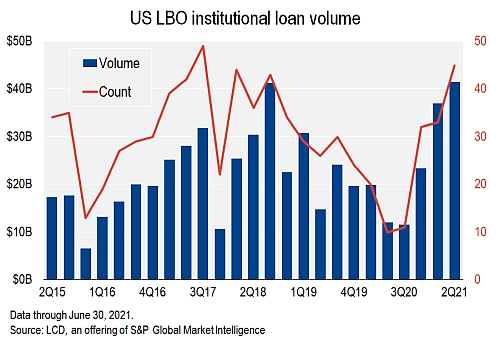
LBO loan volume in the quarter totaled $41.5 billion, spread over 45 deals, a pace not seen since 2007. The volume in the first half of this year exceeded the full-year total for 2020.

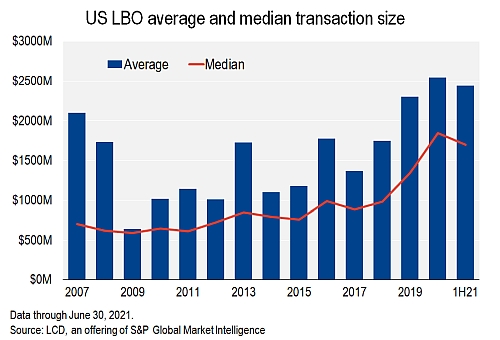
Over the past three years, the size of buyouts, on average, has topped that of 2007, although there are fewer jumbo LBOs (those exceeding $5 billion) today, according to LCD. Indeed, 19% of the roughly 200 LBOs tracked in 2007 had a transaction size less than $250 million. This share has declined to less than 3% in the last three years.
This may suggest that borrowers and their private equity sponsors are turning to private credit to finance buyouts, rather than syndicated loans. This is likely especially true for smaller LBOs that a growing number of private credit providers are willing, and able, to finance.
Financing in the private credit market may offer more certainty on pricing of a deal and eliminate syndication risk. It also means fewer lenders to negotiate with in case of a workout of the debt.
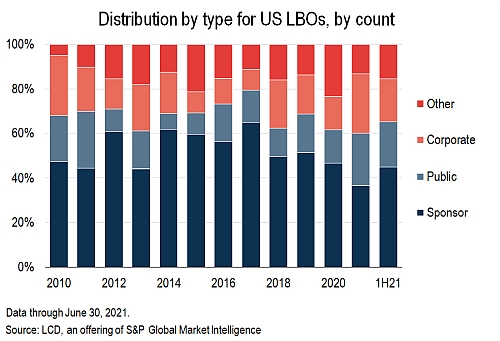
Many of the LBO targets among deals tracked by LCD were backed by private equity sponsors, as secondary buyouts, although this share has been shrinking in recent years.
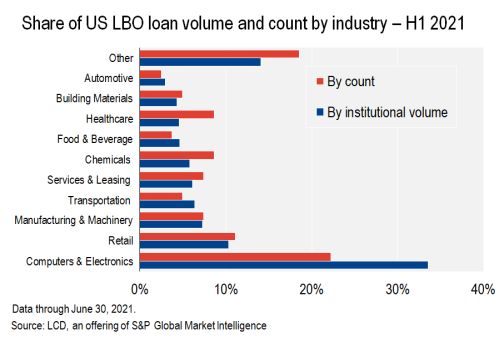
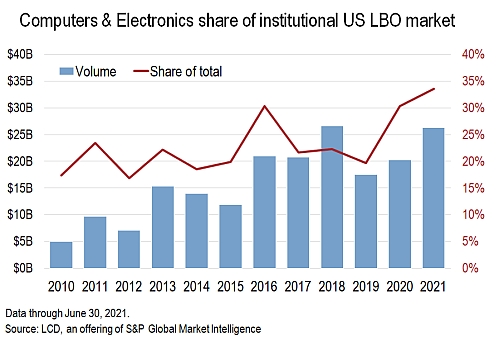
Notably, over one third of buyout loans tracked by LCD in the first half of 2021, or 34% by volume, were tech deals. (Note that LCD uses the Computers & Electronics category as a proxy for tech.) The retail sector followed in a distant second place, with 10% of the total LBO volume.
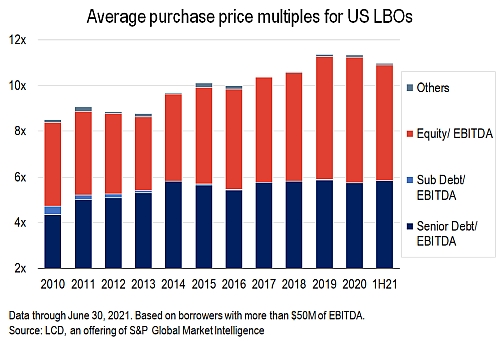
Despite the frenzied pace surrounding volume of LBOs and risk-on market conditions, the average purchase price multiple for large corporate buyouts has declined from the levels touched in 2019 and 2020, according to LCD.
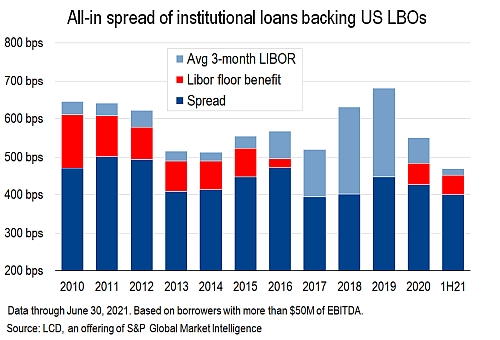
Behind the second-quarter trends are accommodative credit markets. Indeed, the cost of raising funding in the leveraged loan market — the primary source of debt financing for buyouts — is at the lowest point since the global financial crisis. The average LBO loan spread in the first half of 2021 was in line with levels of 2017-18. However, due to the significant drop in Libor since the onset of the pandemic, the total borrowing cost is significantly lower even after incorporating the effect of Libor floors. The borrowing cost of LBO-related loans issued this year stood at roughly 4.7%, based on the average spread of 401 basis points, a 50 bps Libor floor benefit and a 90-day Libor average of 18 bps. In contrast, in 2018, the average spread was the same, but with 90-day Libor exceeding 2%, the overall cost of debt stood at 6.3%.
Libor floors are structured into many loan agreements to ensure a return for the investor, should Libor drop beneath the specific floor amount.
The data shows a degree of restraint in the market. The average leverage remains under 6x, the debt/EBITDA ratio that 2013 Federal Leveraged Lending guidelines stipulated as a level that raised concerns.
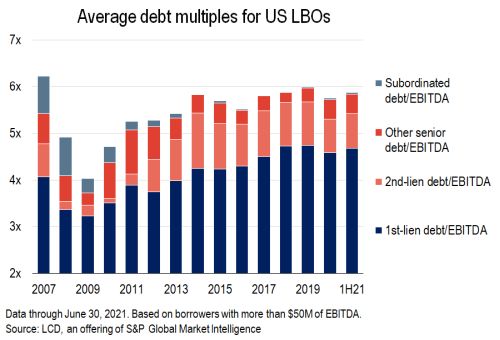
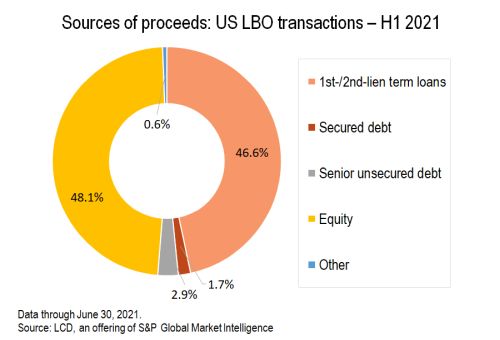
The share of first-lien debt has increased in recent years. In the first half of 2021 the source of debt proceeds backing the average LBO transaction was derived 47% from first- and second-lien term loans, 48% from equity and roughly 5% from high-yield bonds, according to LCD.
Below are the five-largest LBO deals in the second quarter of 2021, based on first-lien institutional loan size:

