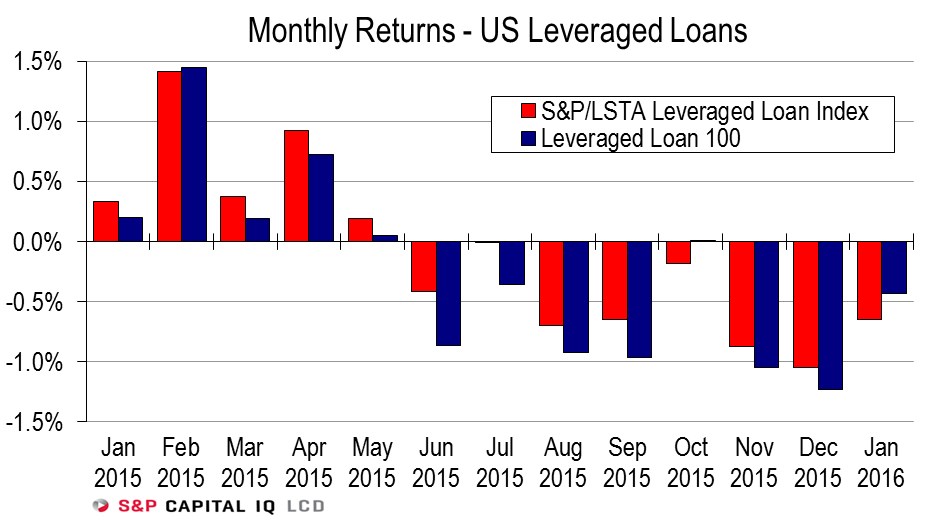
After briefly stabilizing in the opening days of 2016, U.S. leveraged loan prices slumped anew in January amid weak technical conditions and negative investor sentiment.
As a result, the S&P/LSTA Loan Index was down 0.65% in January after falling 1.05% in December. The largest loans, which constitute the S&P/LSTA Loan 100, slightly outperformed in January, returning negative 0.43%, after lagging behind in December at negative 1.23%.
January extended the S&P/LSTA Index’s run of red ink to eight months and counting. That is the longest losing streak on record, surpassing the prior mark of six months from the second half of 2008. Of course, the scale of the loss in 2H08 was far steeper at negative 28.32%, versus negative 4.45% between May 2015 and January of this year. – Steve Miller
Follow Steve on Twitter for an early look at LCD analysis on the leveraged loan market.
This story first appeared on www.lcdcomps.com, LCD’s subscription site offering complete news, analysis and data covering the global leveraged loan and high yield bond markets. You can learn more about LCD here.


