These charts are taken from LCD’s seriously comprehensive 4Q US Leveraged Loan Market Wrap Up, written by Steve Miller. You can learn more about LCD here.
The final quarter of 2015 brought what was already a challenging year for the U.S. leveraged loan market to a less than-jolly conclusion. First and foremost, new-issue volume stalled. Sputtering loan demand was the proximate cause, despite an environment of solid credit fundamentals.
In short, here’s how the fourth quarter, and the year, went.
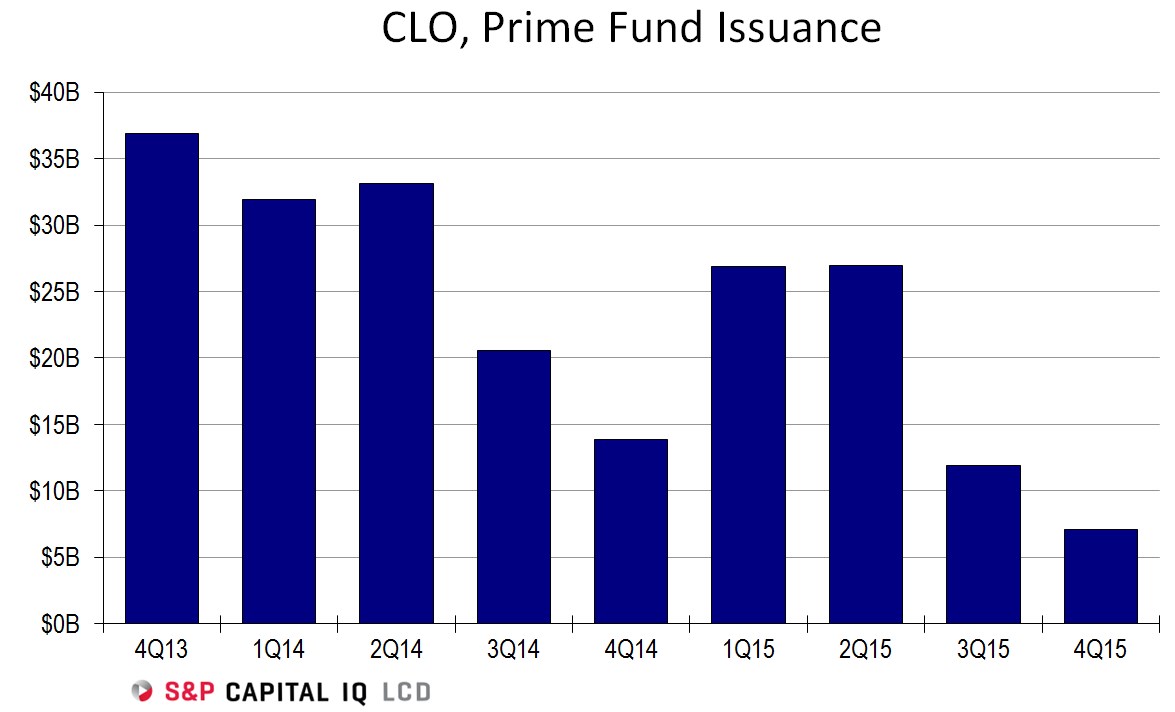
With capital formation falling …
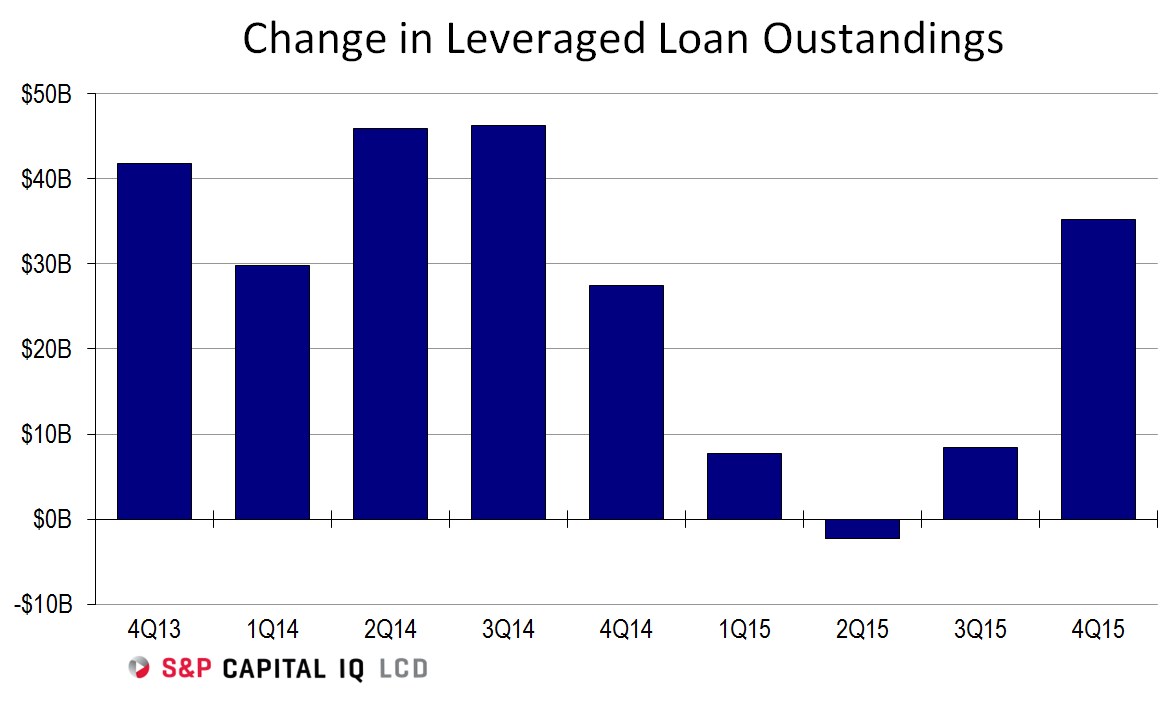
… and supply rising …
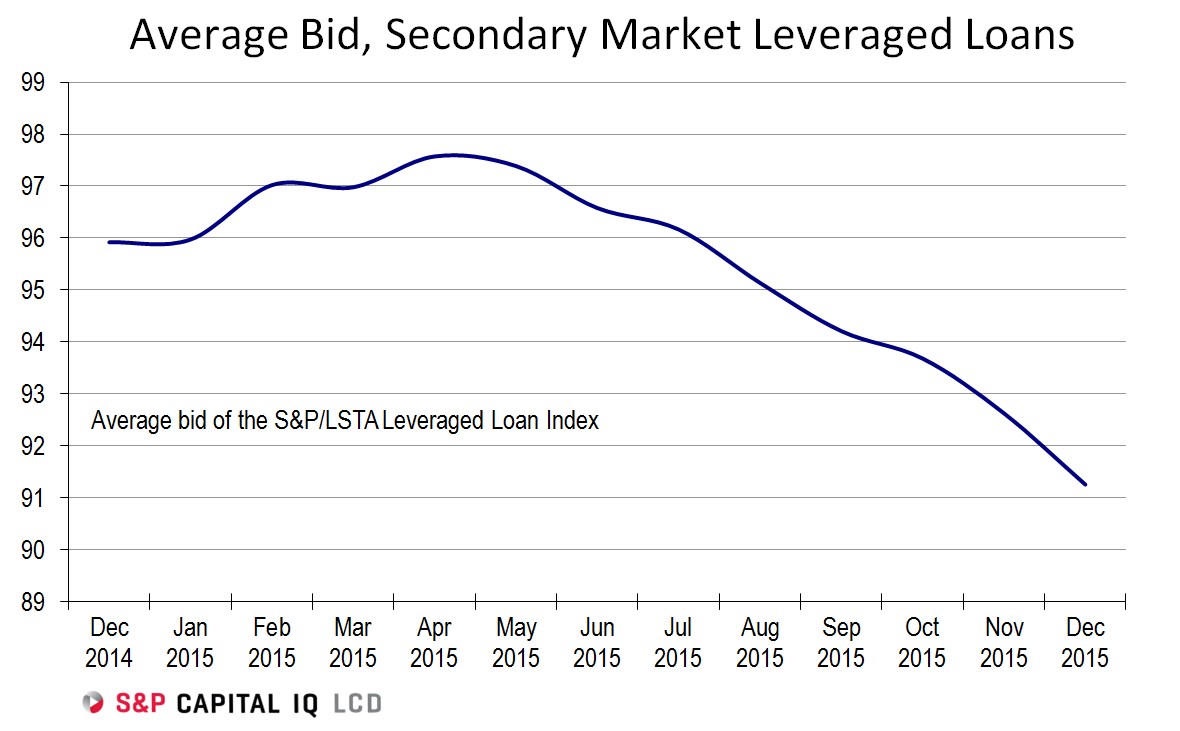
… leveraged loan prices fell further in the secondary during the fourth quarter.
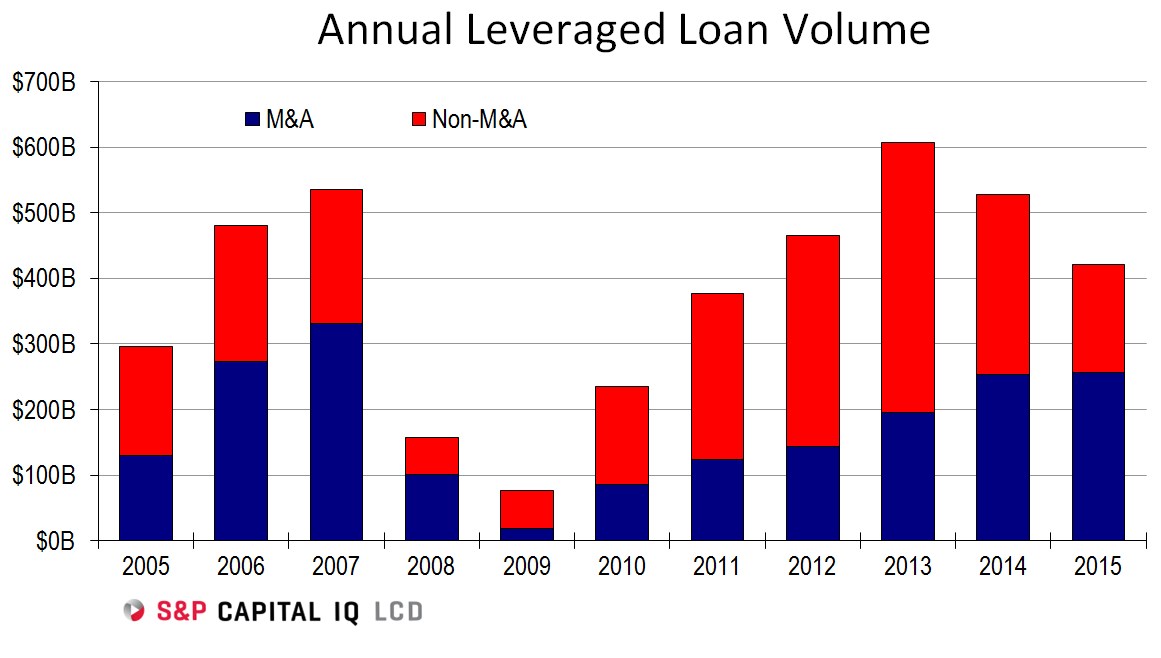
New-issue volume also fell (especially ‘opportunistic’ activity) …
… extending the year-long slump.
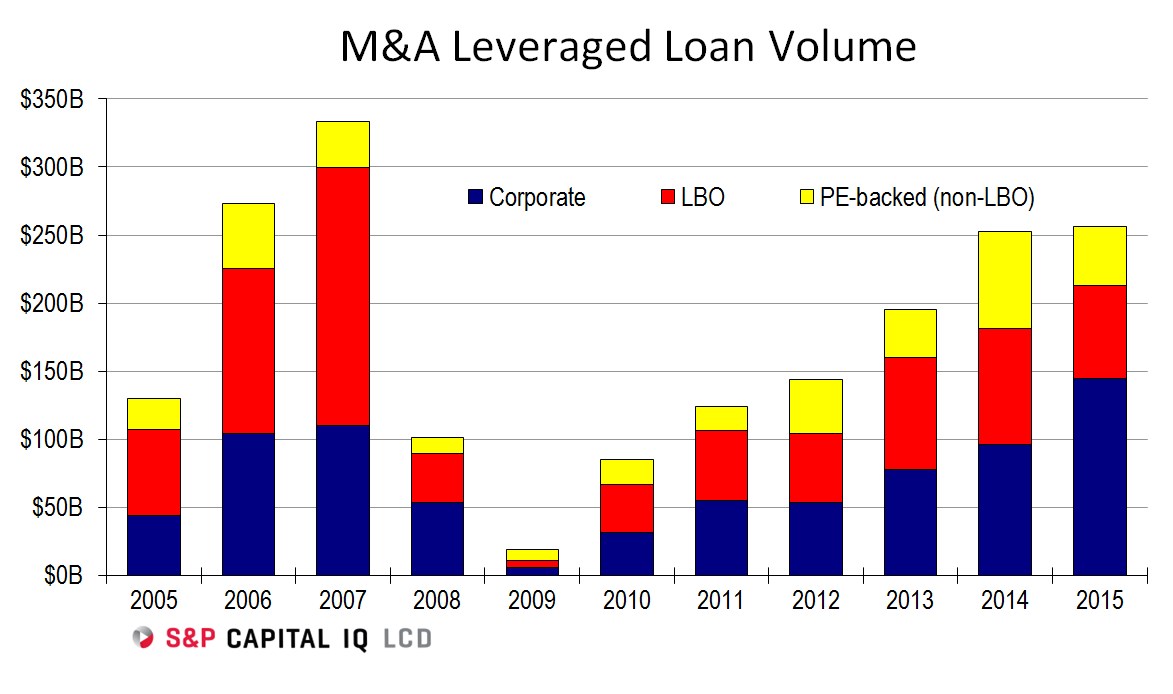
Digging deeper, LBO activity faded in 2015, while corporate activity thrived.
Follow Steve on Twitter for an early look at LCD analysis on the leveraged loan market.


