S&P Global Offerings
Featured Topics
Featured Products
Events
S&P Global Offerings
Featured Topics
Featured Products
Events
S&P Global Offerings
Featured Topics
Featured Products
Events
Banking & Capital Markets
Economy & Finance
Energy Transition & Sustainability
Technology & Innovation
Podcasts & Newsletters
Banking & Capital Markets
Economy & Finance
Energy Transition & Sustainability
Technology & Innovation
Podcasts & Newsletters
S&P Global Offerings
Featured Topics
Featured Products
Events
9 Mar, 2022

By Eric Oak
Shipping rates out of China have dipped, likely providing some relief to shippers even if they are still elevated. Shanghai Shipping Exchange data indexing rates out of China fell 5.6% since the week of Feb. 11. This represents an escalation of 1.3% from the start of 2022 but could indicate a slowdown in rate growth. Unfortunately for shippers, rates remain 285.6% higher than levels seen at the beginning of 2020.
Narrowing down the index to specific routes, rates from China to the U.S. West Coast were down 6.1% from the week of Feb. 11 and fell 0.5% over the past week. Part of this could be due to the continuing efforts to alleviate congestion at U.S. West Coast ports, with the recent announcement of additional temporary storage for containers adding to policies like higher stack heights, longer operations and increased load limits. Rates to the U.S. West Coast have increased 6.4% since the start of 2022, while rates to Europe have risen 8.1% in the same time frame. Rates to Europe have outpaced the average rate as well as rates to the U.S. West Coast, rising 427.0% from the start of 2020 as of last week, after escalating sharply in late 2020 before pausing and climbing sharply again around the time of the Ever Given grounding in the Suez Canal.
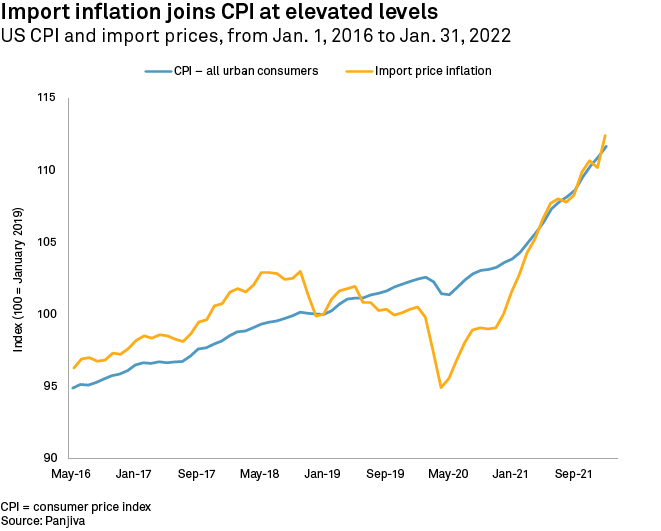
The effects of freight rate increases have been passed through to prices, influencing inflation. In addition, increases in demand — driven by multiple factors, including the business incentive to order more goods — have also added to inflationary pressures. The price of imported goods can be easily tracked using data from the Federal Reserve. The import price index increased 10.8% year over year in January, exceeding the consumer price index that increased 7.5% year over year. The consumer price index has been steadier over the past few years, while import prices have been affected by the trade dispute with China and the COVID-19 pandemic, representing a more direct method of gauging business costs.

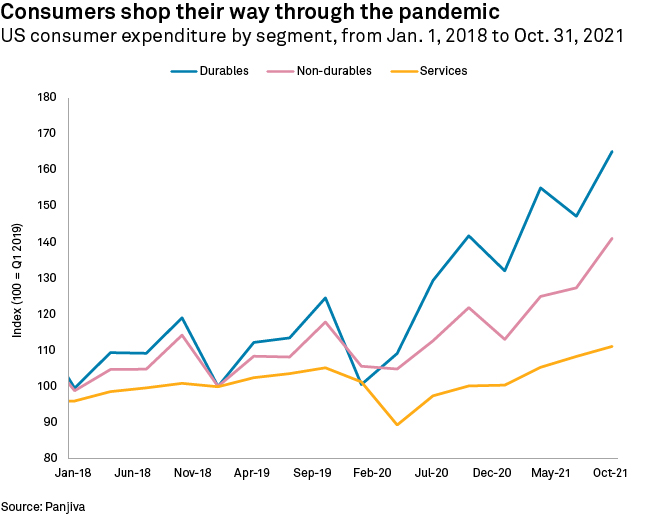
The other factor driving up supply chain prices has been the shift in consumer preferences since the onset of the pandemic. Consumption of durable and non-durable goods, as tracked by the Federal Reserve, have increased 32.6% and 19.7% year, respectively, over year in the third quarter of 2021 against the third quarter of 2019. Goods — certainly durable goods — often require more logistical and physical support in the form of supply chains and storage than services do. The transit, processing and production of goods often have myriad inputs, and constraints to those systems can limit supply. Many services avoid this problem, either by having a single input, like a person, that can flexibly adapt to changes in supply and demand, or by using automated systems with more theoretical usage limits like online entertainment.

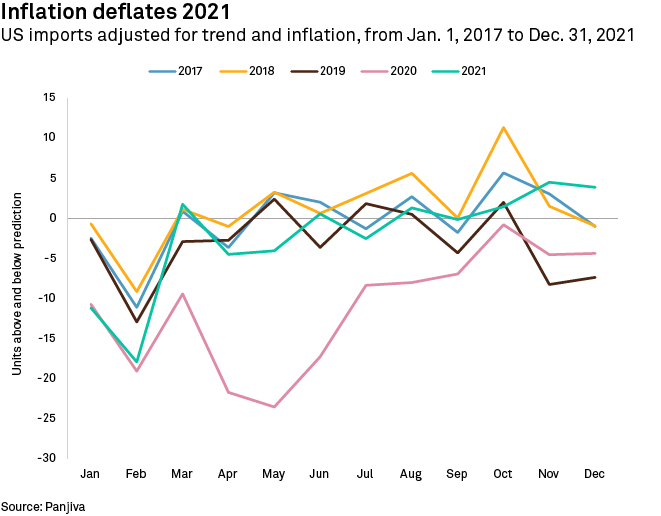
Adjusting U.S. macro imports for inflation and trends exposes both seasonality and outliers in import data. Panjiva previously showed that adjusting volume-based import data for long-term trends exposes the seasonality of U.S. imports, and this can be extended on dollar-based data by incorporating inflation information. On a broad basis, either the consumer price index information or import price data can be used, and more detailed time series exist for both products for those interested in analyzing a specific segment. For this simple analysis, import prices were used as the deflator as they more closely match the source of U.S. macro import data.
Regressing out time (for the long-term trend) and import price effects from 2010 to 2019 reveals both the seasonality of the data and any remaining error. Imports in 2020 immediately stand out, the pandemic dropping imports well below the predicted levels of the model. The record year of imports in 2021 is relatively close to the model's prediction, however, indicating that both trend and inflation remove much of what makes the year exceptional. This does not reduce the congestion impact felt by businesses — as the goods those dollars represent still filled up supply chains — but provides an example of how U.S. import data can be expanded and explained by related datasets. The model shows that imports from a trend and inflation-adjusted perspective were not out of range from a macroeconomic standpoint.

Eric Oak is a researcher at Panjiva, a business line of S&P Global Market Intelligence, a division of S&P Global Inc. This content does not constitute investment advice, and the views and opinions expressed in this piece are those of the author and do not necessarily represent the views of S&P Global Market Intelligence. Links are current at the time of publication. S&P Global Market Intelligence is not responsible if those links are unavailable later.
