S&P Global Offerings
Featured Topics
Featured Products
Events
S&P Global Offerings
Featured Topics
Featured Products
Events
S&P Global Offerings
Featured Topics
Featured Products
Events
Banking & Capital Markets
Economy & Finance
Energy Transition & Sustainability
Technology & Innovation
Podcasts & Newsletters
Banking & Capital Markets
Economy & Finance
Energy Transition & Sustainability
Technology & Innovation
Podcasts & Newsletters
S&P Global Offerings
Featured Topics
Featured Products
Events
15 Jul, 2021
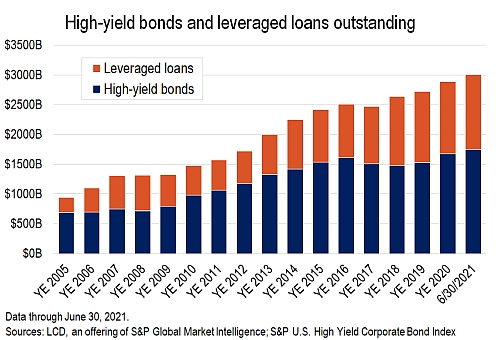
For the first time ever, the U.S. leveraged finance market has topped $3 trillion in size, according to S&P Global and LCD indexes tracking the high-yield bond and leveraged loan segments.
These combined asset classes more than doubled in volume amid a rapid growth in sub-investment-grade borrowing between the crunch points of the 2008 Global Financial Crisis and the pandemic-driven crash of 2020.
These speculative-grade debt markets, as measured by LCD's S&P/LSTA Leveraged Loan Index and the S&P U.S. High Yield Corporate Bond Index, held respective year-end market sizes of just $529 billion and $792 billion in 2009 — the official start of a record-setting bull market run. By the end of 2019 the volume of outstanding leveraged loans had ballooned by 127%, with high-yield bonds growing by 92%.

More recently, after the relatively short-lived crash in 2020, it's the high-yield asset class that has led the charge in growth, increasing outstandings by $144.7 billion since the beginning of the second quarter of 2020.
The $1.3 trillion market of leveraged loans, by comparison, has grown by $68.2 billion since then.
Of course, the size of the debt markets has typically depended on new issuance. To wit, high-yield activity came roaring back to life after the Federal Reserve's bond buying spree. Historically low yields, however, have given rise to an increased share of refinancings (accounting for 71% of supply in the first half of 2021), suggesting other factors are at play.
Looking first at supply, a record $435 billion of high-yield debt was issued in 2020, according to LCD. But just $48 billion of this amount — or 11% — was from mergers and acquisitions, a lifeblood of net new issuance in the leveraged finance world. By comparison, M&A-related issuance, on average, made up 27% of high-yield supply in the five years through the end of 2019.
Things are looking up in this regard for high yield, with $37.4 billion of M&A/LBO volume in the second quarter of this year marking a record high, ahead of the prior peak in the second quarter of 2015 ($33.2 billion).

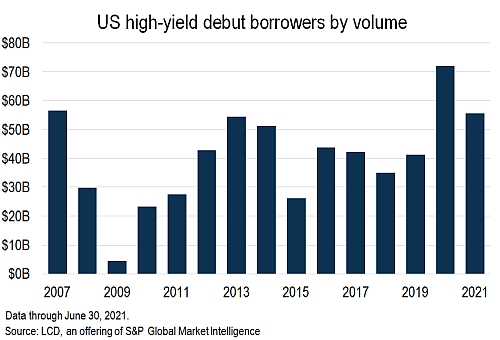
Also aiding new supply, first-time borrowers have had a good run in accessing funding in high yield of late, with debut issuance totaling nearly $56 billion in the first half of this year, building on a record $72 billion during all of 2020.

Most notably, though, fallen angel activity was a growth area for both high yield and leveraged loans. Some $285 billion of nonfinancial U.S. corporate fallen angel debt moved from investment-grade to speculative-grade in 2020, a 15-year high, according to S&P Global Ratings. That compares to just $53 billion in 2019.
Floating on
While leveraged loans lost market share to high yield in 2020, the floating-rate asset class, after a record first quarter in 2021 for total issuance, is tracking an unprecedented pace for M&A supply, at $159 billion in the first half of the year. This exceeded any comparable period, edging the $154 billion in the first half of 2018 (that year sported an annual record for M&A activity).

The broadening of high-yield and leveraged loans to a $3 trillion asset class benefits from context, given that this exponential growth is by no means an isolated leveraged credit event. In fact, the U.S. investment-grade-rated corporate debt market is now sized at more than $7.57 trillion, according to S&P Global Ratings, having also doubled since the Global Financial Crisis.
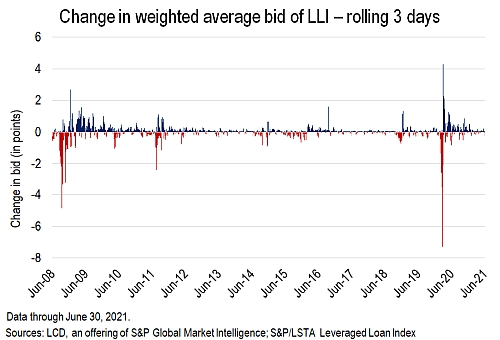
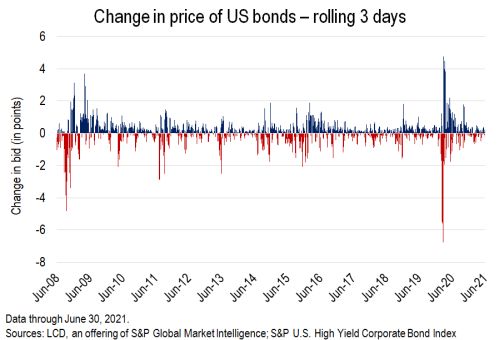
Finally for this analysis, LCD took a look at the average three-day movement in secondary prices, to measure fluctuations during this period of expansion. Despite the rapidity of the growth of the leveraged loan market, the average price movements have generally narrowed, with some exceptions.
In 2009, the average three-day change in the weighted average bid was 32 basis points. By 2017, this had fallen to 3 bps, before rising in 2019 and 2020, as cash began to exit the market amid falling Treasury yields and the record volatility around the pandemic crash.
In high yield, the average change in secondary prices on a rolling-three-day basis fell from 62 bps in 2009 to 23 bps in 2019.


