S&P Global Offerings
Featured Topics
Featured Products
Events
S&P Global Offerings
Featured Topics
Featured Products
Events
S&P Global Offerings
Featured Topics
Featured Products
Events
Banking & Capital Markets
Economy & Finance
Energy Transition & Sustainability
Technology & Innovation
Podcasts & Newsletters
Banking & Capital Markets
Economy & Finance
Energy Transition & Sustainability
Technology & Innovation
Podcasts & Newsletters
S&P Global Offerings
Featured Topics
Featured Products
Events
Blog — 13 Mar, 2023
By Stewart Webster and Gajan Vivek
This article is written and published by S&P Global Market Intelligence, a division independent from S&P Global Ratings. Lowercase nomenclature is used to differentiate S&P Global Market Intelligence credit scores from the credit ratings issued by S&P Global Ratings.
Key takeaways:
A Heightened Market Signal PD Before Collapse
Our Market Signal Probability of Default (PDMS) model is a Merton-based model that incorporates an entity’s equity market volatility enabling a market-implied view of credit risk.
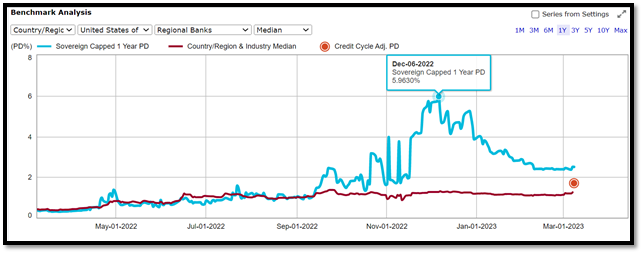
The PDMS initially signaled instability with SVB Financial Group’s (SVB) creditworthiness in September 2022 when the model’s forecasted 1 year PD increased from 1.1% to 2.5% over 10 days. SVB’s PD peaked on December 6, 2022 with a 6% 1 year PD, which mapped to a ‘b-‘ credit score. This is nearly 5x higher than the US Regional Banks sector median PD of 1.27% for the same period. According to the Market Signal PD model, the median PD for the US Regional Banks sector remained constant during 2022 which infers distinctive risks for SVB relative to sector peers.

Figure 1: Market Signal Probability of Default for SVB Financial Group (SVB)
Source: Credit Analytics, S&P Global Market Intelligence. Data as of March 6, 2023
Market Signal PD Timeline of Recently Collapsed Regional Banks
Silvergate Capital Corporation (NYSE: SI)

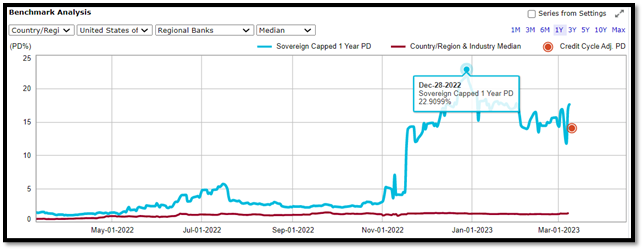
Figure 2: 1 year Market Signal Probability of Default (PDMS) for SilverGate Capital Corporation
Source: Credit Analytics, S&P Global Market Intelligence. Data as of March 6, 2023
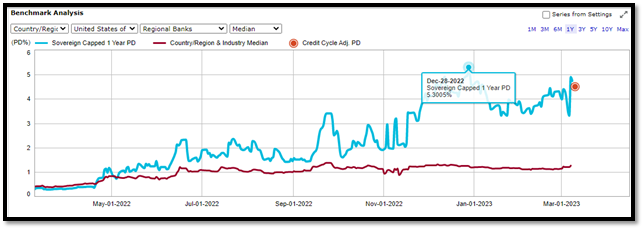
Signature Bank (NasdaqGS: SBNY)

Distribution of Market Signal PDs for the US Regional Banks Sector
(1 year PDs for regional banks who have not received a bailout or support as of March 13, 2023)
|
Regional Banks with the Highest Market Signal PD |
|
|
Regional Bank Name |
PD% |
|
Bank 1 |
12% |
|
Bank 2 |
10% |
|
Bank 3 |
10% |
|
Bank 4 |
8% |
|
Bank 5 |
8% |
|
Bank 6 |
7% |
|
Bank 7 |
7% |
|
Bank 8 |
6% |
|
Bank 9 |
6% |
|
Bank 10 |
5% |
Figure 3: US Regional Banks with the 10 Highest Market Signal PDs
Source: Credit Analytics, S&P Global Market Intelligence. Data as of March 6, 2023
|
Regional Banks with the Lowest Market Signal PD |
|
|
Regional Bank Name |
PD% |
|
Bank 1 |
0.05% |
|
Bank 2 |
0.07% |
|
Bank 3 |
0.14% |
|
Bank 4 |
0.17% |
|
Bank 5 |
0.20% |
|
Bank 6 |
0.20% |
|
Bank 7 |
0.25% |
|
Bank 8 |
0.26% |
|
Bank 9 |
0.27% |
|
Bank 10 |
0.28% |
Figure 4: US Regional Banks with the 10 Lowest Market Signal PDs
Source: Credit Analytics, S&P Global Market Intelligence. Data as of March 6, 2023
According to the Market Signal PD model, the median sector PDMS for the US Regional Banks sector is 1.2% as of March 2023. There is a wide dispersion between the riskiest banks and safest banks. As the US economy continues to experience heightened uncertainty and market volatility, there could be hidden risks in the banking sector. S&P Global Market Intelligence’s Market Signal PD model and fundamental credit models that incorporate early warning signals may help you reveal the idiosyncratic risks you’re exposed to. How does your counterparty rank on the risk spectrum? Find out with S&P Global Market Intelligence’s Credit Analytics.
To learn more about Credit Analytics please visit here https://www.spglobal.com/marketintelligence/en/solutions/credit-analytics(opens in a new tab)
