


Blog — 16 Oct, 2023
Net Zero 2050: How Climate Risk May Reshape the FTSE 100

This article is written and published by S&P Global Market Intelligence, a division independent from S&P Global Ratings. Lowercase nomenclature is used to differentiate S&P Global Market Intelligence credit scores from the credit ratings issued by S&P Global Ratings.
The Net Zero 2050 commitment aligns with global climate goals, particularly the Paris Agreement's aim to limit global warming to below two degrees Celsius above pre-industrial levels. As the UK's main stock market index, the Financial Times Stock Exchange 100 Index (FTSE 100) represents a good reference in measuring the country’s progress towards meeting these ambitious targets.
By committing to net-zero emissions by 2050, FTSE 100 companies can better prepare for future environmental regulations, reduced risk of legal penalties and liabilities related to greenhouse gas emissions. Ultimately, the change to their financial performance and future expectations will have a direct impact on their access to capital and costs of financings, a crucial factor for banks, asset managers and investors, that are subject to climate-related disclosures.
Within this blog, we present the summary of our stress testing analysis, utilizing the Network for Greening the Financial System (NGFS) “Net Zero 2050” projections to analyse the influence on company financials as well as the creditworthiness.[1][2] For that analysis we have used the Climate Credit Analytics model.[3][4]
Climate Credit Analytics (CCA) is a climate scenario analysis and credit analytics model suite developed by S&P Global Market Intelligence and Oliver Wyman™.[5] These tools combine S&P Global Market Intelligence’s data resources and credit analytics capabilities with Oliver Wyman’s climate scenario and stress-testing expertise. CCA enables comprehensive and consistent modelling for 145 sub industries including a sector specific evaluation of key high carbon-emitting sectors.
Figure 1: Relative Probability of Default (PD) change under Net Zero 2050
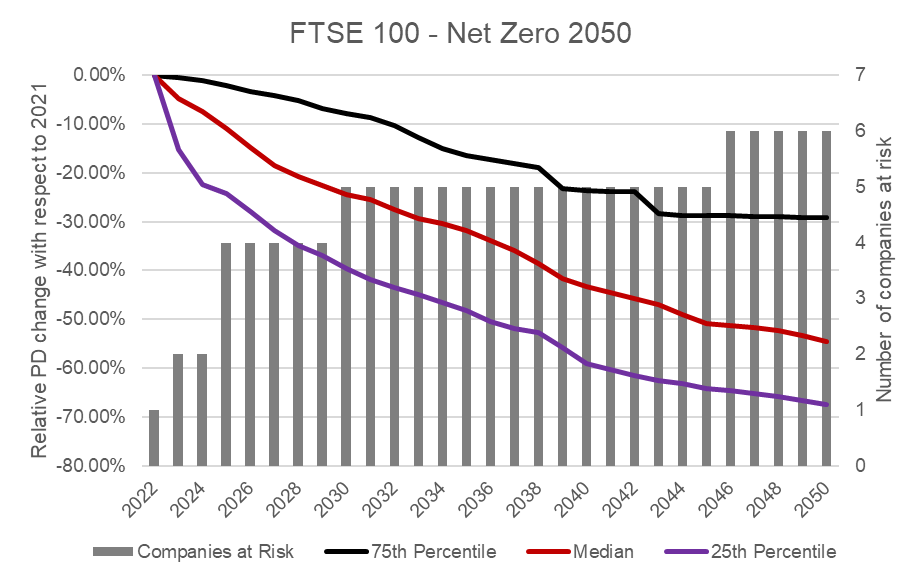
Source: Climate Credit Analytics, S&P Global Market Intelligence. As of: September 25, 2023.
Figure 1 shows the relative change in PD from year end 2021, as well as the accumulated number of companies at risk, between b- and the ccc+. The relative PD change is shown in the upper quartile (75th Percentile), median (50th Percentile) and lower quartile (25th Percentile) to underline the distributional characteristics and heterogeneity. The quartiles of the distribution reflect groupings by distributional characteristics of the PD change at every period. Therefore, at each period from 2022 to 2050, the PD change with respect to 2021 is calculated, leading to a different set of constituents in every quartile at each period. Additionally, there is no reduction of observations across the periods – Static Balance Sheet Assumption.
The results indicate that across the distribution, the creditworthiness improves for most of the companies with diverse materiality, with the top 25% of the sample improving their creditworthiness by more than 2-fold vs. the bottom 25%. In other words, companies will improve their creditworthiness by decreasing their PD between 30% and 70%. Although some companies will benefit from this change, others will struggle with the added pressure. In fact, the number of companies at risk increases over the course of the scenario, from one to six, or in percentage terms from 1.5% to nearly 10%.
Figure 2: Transition matrix across Industries
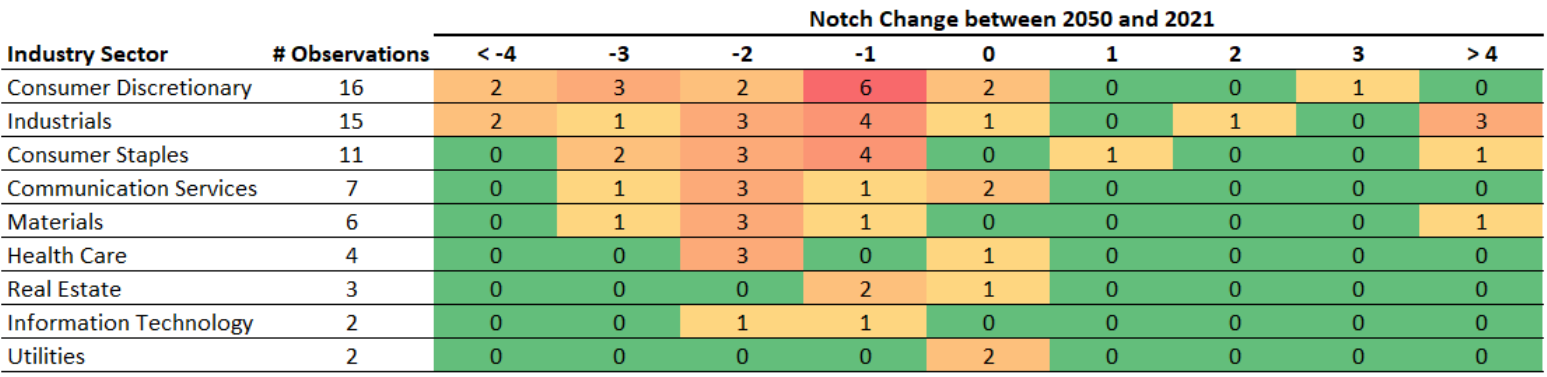
Source: Climate Credit Analytics, S&P Global Market Intelligence. As of: September 25, 2023.
Our analysis shows that the impact of Net Zero 2050 is not the same across industries. Namely, the materiality of climate risk varies across industry sectors, and no industry within FTSE 100 exhibits the same dynamics as another. The matrix in Figure 2 highlights the industries that are more exposed to the climate transition and allows for a comparative analysis across peer companies within industries.
The Industrials sector, for example, is affected in a heterogeneous manner. As Figure 2 shows, three companies have experienced a credit deterioration of more than four notches, while nine entities do improve their credit score. In contrast, all the entities in the Information Technology sector have seen their credit quality improve.
The Net Zero 2050 commitment is not merely a symbolic gesture, but a strategic plan for FTSE 100 companies. This analysis shows that the commitment to Net Zero 2050 will have a positive impact on the credit quality, and lower cost of financing for most companies.
Nevertheless, as shown above there are not just winners.
Asset managers, banks and investment firms can use the methodology underpinning Climate Credit Analytics, to analyse their own portfolio with respect to single or multiple climate scenario assessments, enabling a more in-depth and holistic understanding of the climate risk impact on their investments and what action to take to improve the financial performance.[9]
Please click here to learn more about these capabilities.
[1] The number of constituents used for the simulation is 66 non-financial companies.
[2] S&P Global Ratings does not contribute to or participate in the creation of credit scores generated by S&P Global Market Intelligence. Lowercase nomenclature is used to differentiate S&P Global Market Intelligence PD scores from the credit ratings used by S&P Global Ratings.
[3] https://www.ngfs.net/en
[4] In our analysis we are considering both transition risk and physical risk under the NGFS (Phase 3).
[5] Oliver Wyman is a global management consulting firm and is not an affiliate of S&P Global, or any of its divisions.
[6] The model used for the PD calculation is the PD Model Fundamentals, part of the Credit Analytics set of statistical credit models.
[7] S&P Global Ratings does not contribute to or participate in the creation of credit scores generated by S&P Global Market Intelligence. Lowercase nomenclature is used to differentiate S&P Global Market Intelligence PD scores from the credit ratings used by S&P Global Ratings.
[8] The choice of using the threshold between the b- and ccc+ is to capture the transition or speculative grade companies into the highest risk range.
[9] Climate Credit Analytics enables counterparty- and portfolio-level analysis of climate-related financial and credit risks for thousands of companies across multiple sectors.