Featured Topics
Featured Products
Events
S&P Global Offerings
Featured Topics
Featured Products
Events
S&P Global Offerings
Featured Topics
Featured Products
Events
S&P Global Offerings
Featured Topics
Featured Products
Events
Financial and Market intelligence
Fundamental & Alternative Datasets
Government & Defense
Professional Services
Banking & Capital Markets
Economy & Finance
Energy Transition & Sustainability
Technology & Innovation
Podcasts & Newsletters
Financial and Market intelligence
Fundamental & Alternative Datasets
Government & Defense
Professional Services
Banking & Capital Markets
Economy & Finance
Energy Transition & Sustainability
Technology & Innovation
Podcasts & Newsletters
Case Study — 25 May, 2023
Highlights
Customer Type: Premier global provider of credit ratings, benchmarks, and financial analytics.
User Base: User Experience, Product Management, Application Development Teams.
Increasingly, financial professionals are faced with the challenge of managing the vast amounts of data available to them, and more importantly, synthesizing insights from it to make informed decisions. To solve this, they often seek interactive platforms with data visualization tools to better understand their data and identify new opportunities for investment. As a provider of these solutions, S&P Global Market Intelligence was looking to enhance the S&P Capital IQ Pro platform with a new charting solution that would give their customers more advanced analytics and stronger data visualization, and ultimately support more complex workflows.
Previously, Market Intelligence leveraged a generalized third party graphics library as the foundation for their charting. This solution met the basic needs of customers but had certain limitations. Specifically, they found that their users were looking for more interactivity, more options for personalization, and a stronger user interface that could support the increasingly advanced workflows required of financial analysts.
In January of 2023, Market Intelligence not only acquired ChartIQ, but they began immediate work to integrate their advanced charting solution into the Capital IQ Pro platform. In three short months, they were able to release the upgraded tool and quickly turn around new value for their customers.
Pain Points
Market Intelligence's existing charting solution needed to meet the needs of modern financial use cases, enabling end users to conduct thorough and comprehensive analysis of complex data. Specifically, their customers needed:
Overall, Market Intelligence customers required a more advanced and sophisticated charting solution that would allow them to interact with data in dynamic ways and customize their charts to their specific requirements.
"The addition of ChartIQ to our S&P Capital IQ Pro platform brings together comprehensive data and workflow with compelling analytical capabilities and advanced charting.” — Warren Breakstone, Head of Desktop and Channel Solutions at S&P Global Market Intelligence

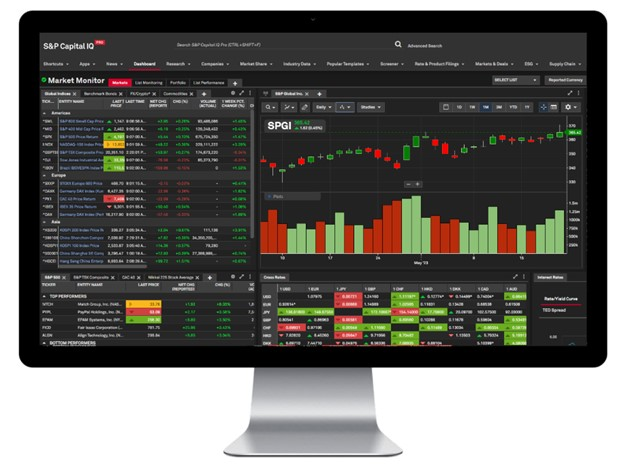
Figure 1 - Capital IQ Pro dashboard featuring the ChartIQ widget.
The Solution
ChartIQ is a modern, professional-grade charting solution that allows customers to visualize data with an interactive, web-based chart library that works seamlessly across web, mobile, and desktop. It's sleek, industry-leading interface is built upon finance-based workflows like trade visualization, options analytics, and technical analysis, and allows customers to visualize their own proprietary or alternative content alongside vendor-supplied data.
After ChartIQ was acquired by Market Intelligence, both development teams began work to quickly release the new charting solution into S&P Capital IQ Pro, Market Intelligence's primary desktop solution. Their goal was to complete the work in 3 months, and for the size of the implementation, this was a breakneck pace that was only achievable through close coordination and quick response times.
The implementation came with its challenges. Being a complicated and highly technical platform, Capital IQ Pro had specific requirements for implementation that often obligated the ChartIQ team to make fast changes and build in new requirements, but they successfully rose to the challenge and quickly moved past roadblocks.
The ChartIQ solution has enabled data within the Capital IQ Pro platform to be more accessible, actionable, and meaningful. It supports the complex workflows of customers, helping them identify trends, optimize processes, and drive better business outcomes.
|
|
Bring any dataset to life with interactive graphic displays. |
|
|
|
Provide technical analysts with a professional-grade charting solution. |
|
|
|
Leverage a full suite of real-time graphics and analytics tools. |
|
|
|
Create linked graphic displays through cross-section plots to visualize term structure, options analytics, and scatterplots. |
|
|
|
Visualize an event spanning time and analyze the impact of each relevant data point on market activity. |
|
Key Benefits
ChartIQ helps customers move from traditional relatively static charts to a rich fully interactive custom data visualization that intuitively explains and engages customers with actionable, tradable data. This premier charting solution brings complex data sets to life for all sectors of finance through a professional-grade HTML5 charting library that works seamlessly on any platform (mobile, web, desktop) or framework (Angular, React). It is pure JavaScript and runs entirely within a web browser. Most companies have at least one financial charting library for each platform or application they target—web, C#, Java, Android, iOS, etc. which means developers must maintain multiple code bases. With ChartIQ, developers can code once and use it everywhere. Additionally, S&P Global Market Intelligence immediately found value in the following:

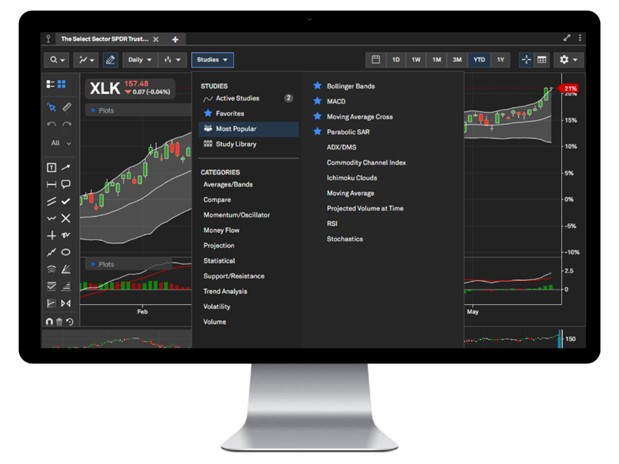
Figure 2 - ChartIQ's UX capabilities.
ChartIQ provides traders and investors with advanced financial charting and technical analysis tools for data-driven decision-making. Click here to learn more about the ChartIQ solution.