S&P Global Offerings
Featured Topics
Featured Products
Events
S&P Global Offerings
Featured Topics
Featured Products
Events
S&P Global Offerings
Featured Topics
Featured Products
Events
Banking & Capital Markets
Economy & Finance
Energy Transition & Sustainability
Technology & Innovation
Podcasts & Newsletters
Banking & Capital Markets
Economy & Finance
Energy Transition & Sustainability
Technology & Innovation
Podcasts & Newsletters
S&P Global Offerings
Featured Topics
Featured Products
Events
Blog — 1 May, 2023
The Premise
At ChartIQ, we take users to the next level with charts that defy their expectations. Our HTML5 charting library is world-renowned for its stellar performance, customization, and easy deployment. You’ll find our charts on millions of desktops around the world (check out Yahoo! Finance, for example).
ChartIQ has historically been based on charting high-velocity financial data. Time series charting is our speciality, and yet the need to have other types of visualizations co-existing with ChartIQ has become apparent as we cater to different client use cases. To solve for this, we undertook an effort to incorporate D3.js into the ChartIQ ecosystem in order to leverage its unique data visualizations.
By creating a bridge between ChartIQ and D3.js, it’s possible to utilize the same dataset between multiple visualizations, resulting in a superior experience than implementing two completely separate visualizations.
A Use-Case
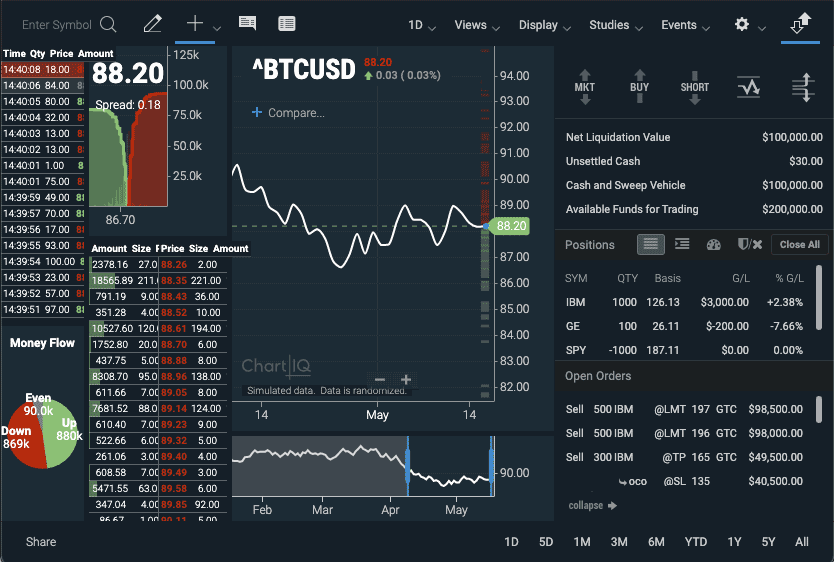
Consider this sample use case for an active trader. You want to view a money flow pie chart as you’re viewing your financial data and order book. This way you can see up, down, and even at-a-glance. A money flow pie chart isn’t a time-series graph like ChartIQ typically draws, so how can we accommodate this use case?
Enter D3.js. D3.js is a general purpose JavaScript library that helps users build beautiful, powerful graphics using modern web languages. D3’s emphasis on web standards gives users the full capabilities of modern browsers without committing to a proprietary framework. D3 is an open source (BSD licensed) project, designed to create powerful data visualizations with flexibility. There are many examples at d3js.org, and we have pre-built examples for you.
The active trader template of ChartIQ uses a pie chart to demonstrate money flow:

For illustrative purposes only
Our pie chart is there in the lower-left corner, synched with our data. So how is this possible?
A Bridge
By leveraging the exact same data feed already present in memory, our D3 implementation doesn’t require additional API calls—that’s all given to you by your ChartIQ quote feed or web sockets integration. The wiring between the exact instance of the chart and the D3 instance(s) provides a single source of truth for the data, with each datum able to be represented in the D3 visualizations.
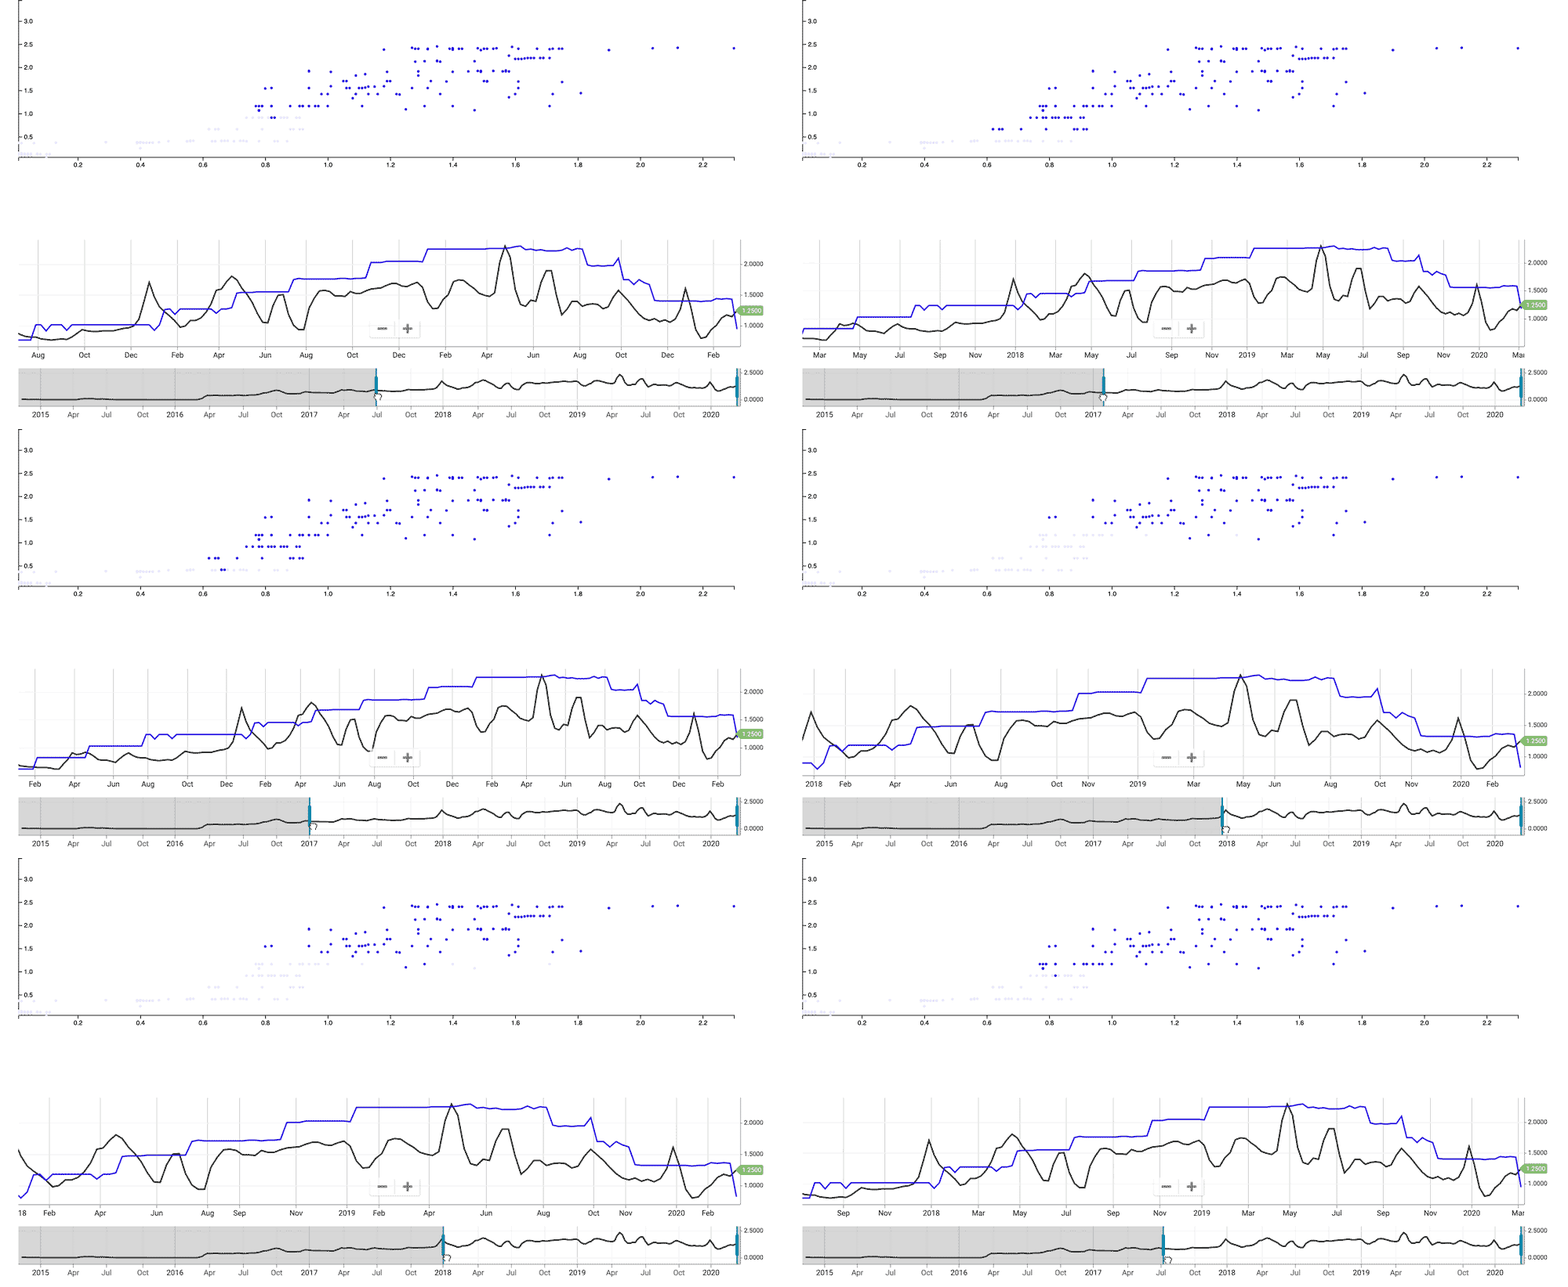
Would you like to use a scatterplot with your time series and range slider? Here’s a proof-of-concept:

For illustrative purposes only
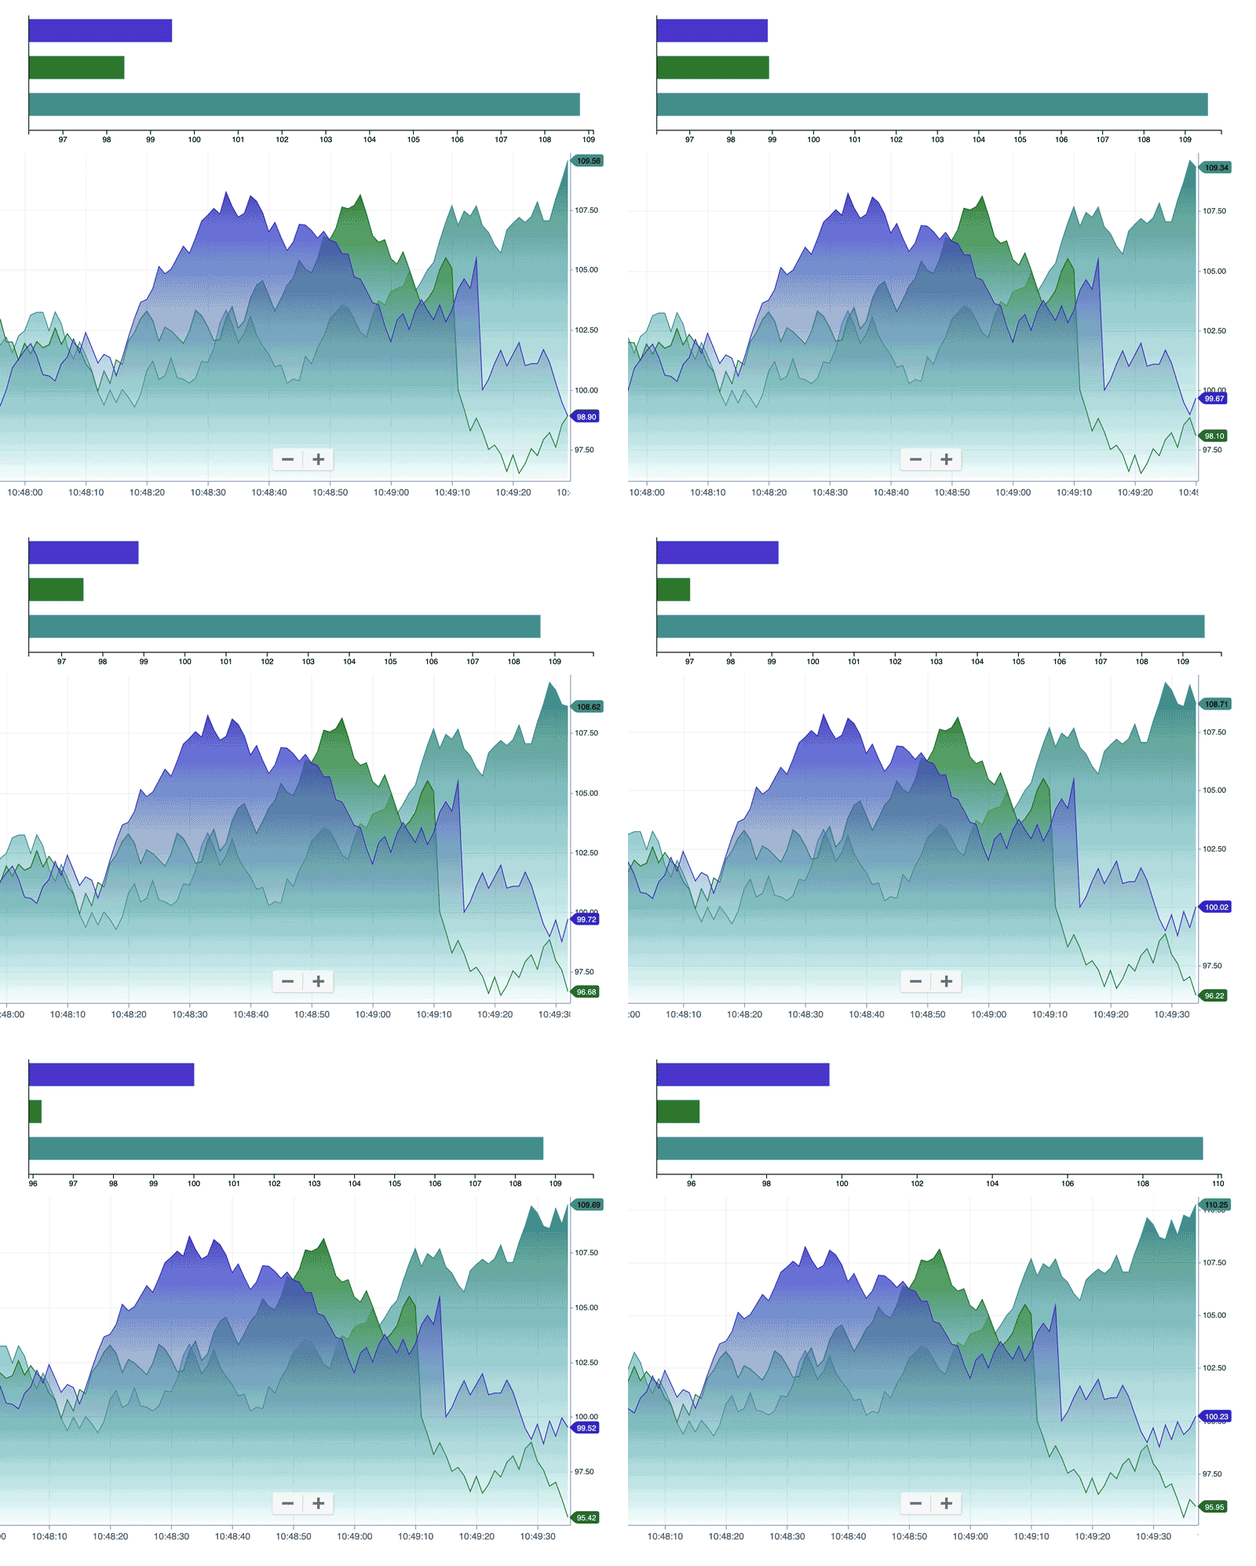
Would you like to pair a bar chart with your ChartIQ mountain chart? Take a look here:
For illustrative purposes only
We have the capability, and the rest can be up to your needs and imagination.
What is provided out-of-the-box?
ChartIQ includes wrappers for piecharts, as well as methods for creating your own wrappers for any other D3.js rendering of your choice. Within the wrappers, the data ingestion methods, node transformations, scaling methods, and the other features of D3 are fully available. More built-in wrappers will be made available in upcoming releases to continue to grow “out of the box” D3 functionality.
ChartIQ’s customization is state-of-the-art and we welcome suggestions for how we can meet the needs of our clients.
