S&P Global Offerings
Featured Topics
Featured Products
Events
S&P Global Offerings
Featured Topics
Featured Products
Events
S&P Global Offerings
Featured Topics
Featured Products
Events
Banking & Capital Markets
Economy & Finance
Energy Transition & Sustainability
Technology & Innovation
Podcasts & Newsletters
Banking & Capital Markets
Economy & Finance
Energy Transition & Sustainability
Technology & Innovation
Podcasts & Newsletters
S&P Global Offerings
Featured Topics
Featured Products
Events
Blog — 13 Jan, 2023
By Gajan Vivek and Stewart Webster
This article is written and published by S&P Global Market Intelligence, a division independent from S&P Global Ratings. Lowercase nomenclature is used to differentiate S&P Global Market Intelligence credit scores from the credit ratings issued by S&P Global Ratings.
Key takeaways:
Probability of Default Market Signal (PDMS)
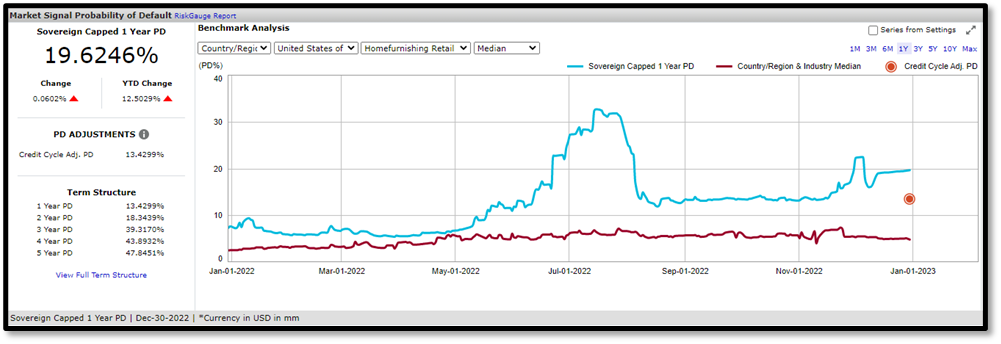
Our PDMS model is a Merton-based model that incorporates an entity’s equity market volatility enabling a market-implied view of a company’s credit risk.
The initial warning from the PDMS model was the divergence between BBBY’s market signal PD and the peer industry’s market signal PD. This behavior occurred as early as April 2022.
Since initial divergence, BBBY’s market signal PD persistently increased and peaked in July 2022 at a 1-year PD of 32%. In contrast with BBBY’s increasing PD, the home furnishing retail peer industry market signal PD remained constant. This demonstrated BBBY’s increased probability of default was due to idiosyncratic risk rather than systematic risk.
 Source: Credit Analtyics, S&P Global Market Intelligence. Data as of December 30, 2023. For illustrative purposes.
CreditModelTM
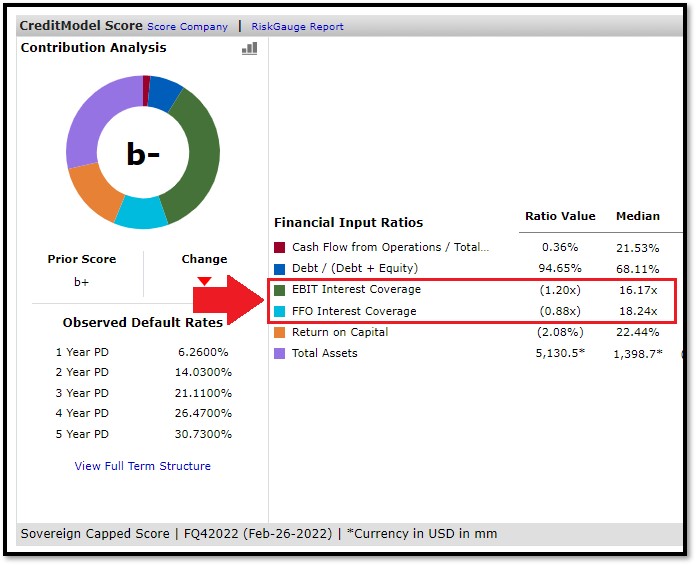
CreditModel is a quantitative fundamental model calibrated on the S&P Global Ratings universe. The model produces a lower-case credit score on a 20-point scale, which follows a ratings scale like an Issuer Credit Rating.
CreditModel's financial input ratios signaled potential issues as early as February 2022 when BBBY’s EBIT interest coverage ratio decreased to -1.2x in February 2022 from 3.76x in November 2021. The negative EBIT interest coverage validated BBBY was unable to service interest expense obligations. The company also experienced negative EBIT in 2020, which also led to negative interest coverage ratios. The earnings deterioration during that period could be due to COVID-19 lockdowns; however according to CreditModel, the peer industry median EBIT and interest coverage remained positive. This occurrence underscored company-specific issues.
 Source: Credit Analtyics, S&P Global Market Intelligence. Data as of December 30, 2023. For illustrative purposes.
Liquidity Deterioration
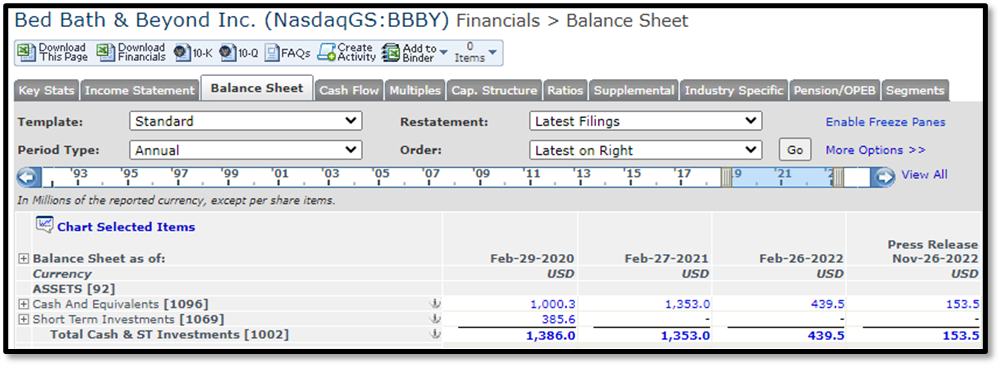
Historically, the company has had volatile changes in cash, however according to S&P Capital IQ Financials, the company used all its short-term investments in February 2021 with additional cash burn as of February 2022 and August 2022. The company also divested assets during that period to pay down debt. The significant reduction in cash caused short-term liquidity pressures which will make their near-dated bond maturities unserviceable. Without revised terms from creditors, there is an increased likelihood of default.
 Source: S&P Capital IQ platform, S&P Global Market Intelligence. Data as of December 30, 2023. For illustrative purposes.
To learn more about Credit Analytics please visit here https://www.spglobal.com/marketintelligence/en/solutions/credit-analytics(opens in a new tab)
Products & Offerings
