S&P Global Offerings
Featured Topics
Featured Products
Events
S&P Global Offerings
Featured Topics
Featured Products
Events
S&P Global Offerings
Featured Topics
Featured Products
Events
Banking & Capital Markets
Economy & Finance
Energy Transition & Sustainability
Technology & Innovation
Podcasts & Newsletters
Banking & Capital Markets
Economy & Finance
Energy Transition & Sustainability
Technology & Innovation
Podcasts & Newsletters
S&P Global Offerings
Featured Topics
Featured Products
Events
Blog — 15 Jul, 2021
By Hangyu Ma, CFA, FRM and Lei Yue
Private companies account for most of the businesses across the world and are a major driving force of economic growth and job creation. However, most are vulnerable to unfavorable business environments, due to their smaller size, lack of transparency, and difficulty in accessing finance. Therefore, it is important for risk analysts and asset managers to have access to early warning signals of credit deterioration to help anticipate the unknown, especially in a post-COVID-19 world as government support measures start fading out.
At S&P Global Market Intelligence, there are several Credit Analytics models serving this purpose. In the following article, we will use Probability of Default (PD) Model Fundamentals 2.0 – Private Corporates (PDFN 2.0 Private) to detect early warning signs of upcoming defaults by looking at real-world examples. PDFN 2.0 Private is a globally applicable fundamentals-based model that leverages company financials and socioeconomic factors to generate PD values for private corporations of any size. This model has been recently recalibrated with a series of new features and enhancements, which better differentiate defaulters from non-defaulters.
Private companies tend to report fundamentals (if at all) with a large delay and at various frequencies (e.g., quarterly for private companies with public debt, and semiannually or annually for small-revenue firms). We will show how a deterioration in creditworthiness can be detected in advance by analyzing PDFN 2.0 Private from the following four dimensions: PD level, PD change, relative PD, and relative PD change. In a separate paper, “Anticipate the Unknown: Go Beyond Fundamentals to Uncover Signs of Private Company Credit Deterioration”, we discuss further signals that can be used.
PD Level and Change
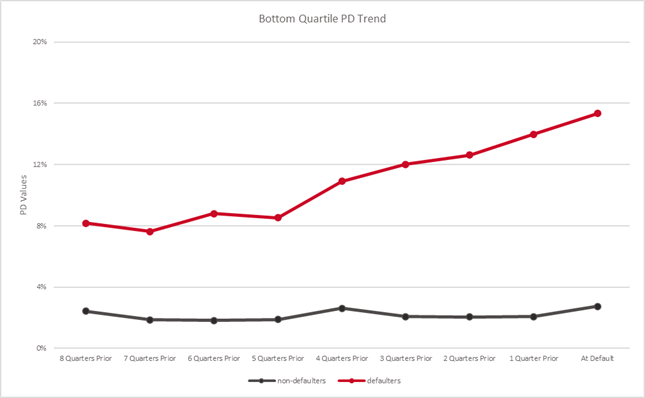
PD level refers to a PD value generated by the model. Past default experience could be valuable in predefining a threshold PD level, beyond which it may signal high risk. Figure 1 below shows the bottom quartile PDs for defaulters and non-defaulters in the model development sample across more than 15 years, and including private firms of any size. More than 75% of defaulters had PDs around 8% two years prior to default, continuously increasing to above 15% at default. On the other hand, PDs of non-defaulters remain relatively stable.
Figure 1: Bottom Quartile PD Trend of Defaulters and Non-Defaulters

Source: S&P Global Market Intelligence as of June 21, 2021. For illustrative purposes only.
PD change refers to quarter-over-quarter (QoQ) change or year-over-year (YoY) change. An alarm bell should ring if a significant PD increase is observed after a relatively steady trend.
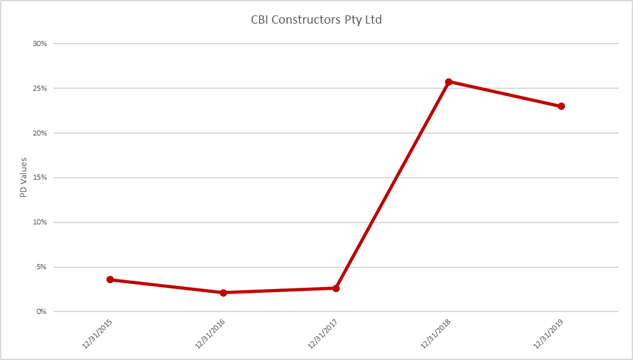
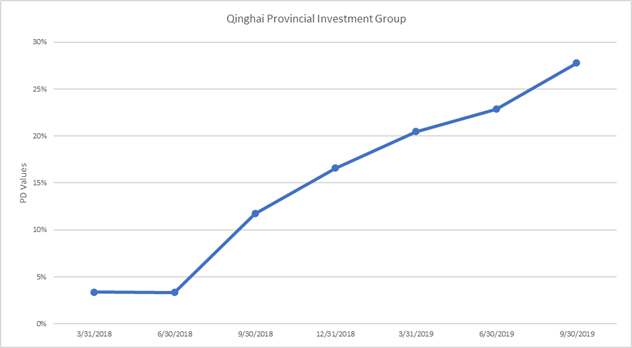
We look at CBI Constructors Pty Ltd, an Australian firm in the small- and medium-sized enterprise (SME) category, as an example. It filed for bankruptcy in January 2020. Figure 2 below shows its PD level, which was relatively stable from Fiscal Year (FY) 2015 to FY 2017, centering around 3%, but then jumped to above 20% in 2018 and beyond. This was worse than the empirical threshold PD level as suggested in Figure 1, based on the model development sample. Another example is Qinghai Provincial Investment Group shown in Figure 3, a Chinese private company with public debt (PCPD) that defaulted in September 2019. The company was also successfully captured by PDFN 2.0 Private, with a progressive PD increase four quarters prior to actual default, equivalent to a four-notch downgrade in terms of PD mapped credit scores.[1], [2],[3]
Figure 2: PD Trend of CBI Constructors Pty Ltd

Source: S&P Global Market Intelligence as of June 21, 2021. For illustrative purposes only.
Figure 3: PD Trend of Qinghai Provincial Investment

Source: S&P Global Market Intelligence as of June 21, 2021. For illustrative purposes only.
Relative PD and Change
Relative PD refers to a company’s PD level relative to its peers in the same industry/country. It can be a strong early warning sign when a company’s PD level ranks remarkably worse in its peer group. Similarly, another warning indicator comes from the divergence between an entity’s PD value and the corresponding industry/country benchmark, i.e., the relative PD change. Analyzing relative PD change can bring attention to additional signals, especially for PCPDs, which typically report financial statements more frequently. For example, a stable company PD level with an overall improving industry/country benchmark may be another red flag.
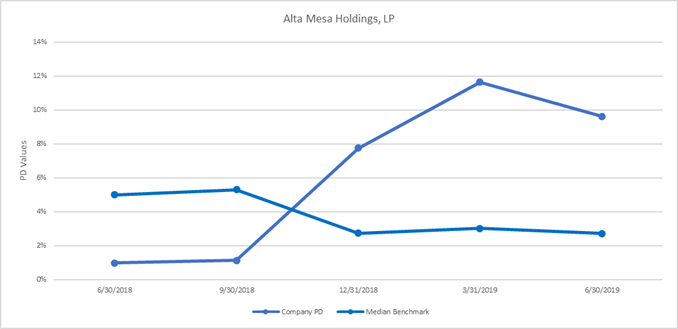
Alta Mesa Holdings, LP, an American private company operating in oil and gas exploration and production, was downgraded from “CCC-” to “D” by S&P Global Ratings in September 2019. Its PD level remained lower than half of its peers until 2018Q4 when the value soared above the median industry and country benchmark values, indicating a drastic deterioration of risk vis-a-vis its peer group. In addition, the divergent trends of the company’s PD and the benchmark signaled higher risk. In this case, both the relative PD and relative PD change analysis signaled upcoming potential credit loss up to nine months in advance.
Figure 4: PD Trend of Alta Mesa Holdings, LP versus Industry & Country Benchmarks

Source: S&P Global Market Intelligence as of June 21, 2021. For illustrative purposes only.
Summary
Detecting early warning signs of credit deterioration is critical, yet challenging, especially for private corporates. This paper provides several ideas that can be used as a starting point to perform a comprehensive analysis from a fundamentals point of view, in conjunction with empirical experience. Although not every sign mentioned above will be followed by a default event, multiple signals should trigger a deeper investigation before potential action is taken. For private companies that are not scored by PDFN 2.0 Private due to missing financials, the four-dimensional analysis could still be conducted based on imputed PD values or estimated PD values from the Expanded PD framework. In the next article, we will go beyond the fundamentals to anticipate the unknown by discussing early warning signals from alternative points of view, such as market-based credit trends, trade payment behavior, and overall creditworthiness.
Learn more about Credit Analytics here >
[1] The company is scored by PDFN 2.0 Private China, a PDFN model tailored for Chinese private companies.
[2] S&P Global Ratings does not contribute to or participate in the creation of credit scores generated by S&P Global Market Intelligence. Lowercase nomenclature is used to differentiate S&P Global Market Intelligence PD mapped credit scores from the credit ratings issued by S&P Global Ratings.
[3] Our model maps each PD value to a credit score that ranges from “aaa” to “c”. The mapping table is updated annually.
Theme
Products & Offerings
