Customer Logins
Obtain the data you need to make the most informed decisions by accessing our extensive portfolio of information, analytics, and expertise. Sign in to the product or service center of your choice.
Customer Logins
EQUITIES COMMENTARY
Jan 19, 2018
Which UK dividends are most stretched?

Notwithstanding our positive outlook for UK dividends, we have identified £3.3bn that is at risk of being cut
- We expect Centamin, Centrica, Debenhams, Restaurant Group and Spire Healthcare to cut their dividend in 2018
- Companies in the healthcare, retail, telecommunications, restaurants and transport sectors are the most exposed
- While the dividend cover in aggregate terms is tight, the median level of cover across firms is comfortable at over 2.2x
We project that UK dividends will reach £88bn in 2018 based on our analysis of FTSE All Share firms (excluding investment trusts). This would be a rise of 6% from last year. However, despite this propitious outlook at an aggregate level, we have identified 20 UK stocks that have a risk of cutting their dividend in the upcoming months due to weak financial ratios or stock specific headwinds. These cuts amount to a potential total of £3.3bn and would reduce aggregate growth to 2%.
There are five FTSE 100 companies in the list: AstraZeneca, BT, Centrica, GlaxoSmithKline and Marks & Spencer. We expect a 30% cut from Centrica starting with its FY18 final dividend announced in 2019, but we are cautiously forecasting that the others will keep payments flat.
Potential dividend cuts and their risk in 2018
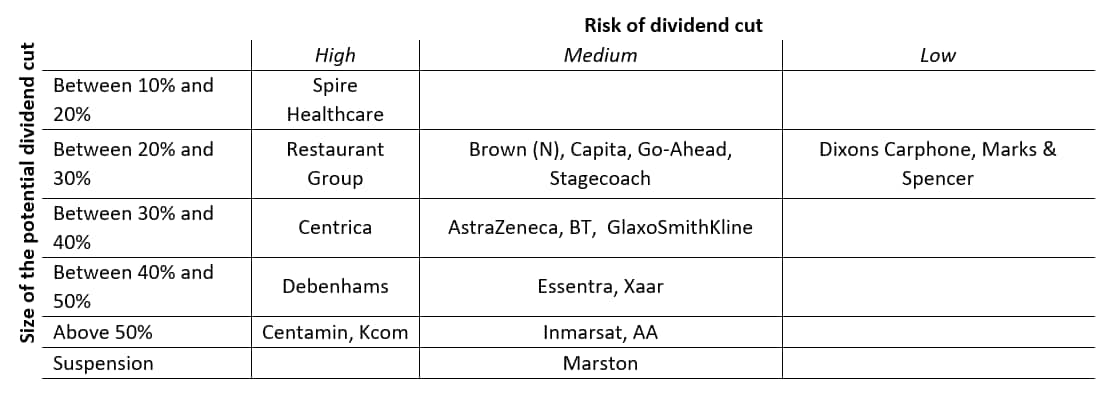
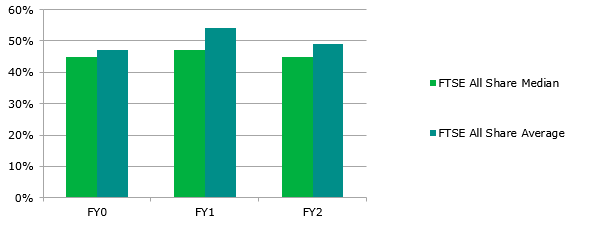
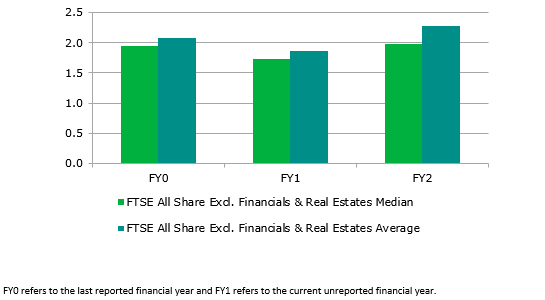
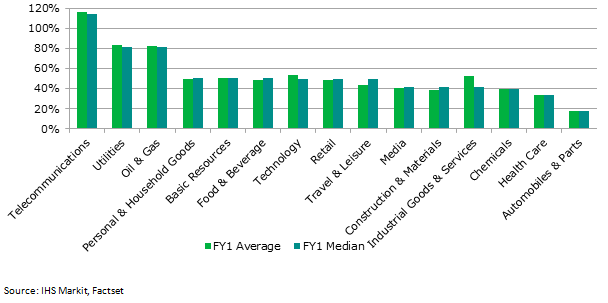
First we highlight five firms which we are forecasting will to cut their dividends, followed by fifteen firms we view as most at risk of a dividend cut – split at a sector level, considering risks in healthcare and telecommunications, then by financial ratios, and lastly where there is a disconnect between the dividend policy and the reality. UK aggregate dividends are highly concentrated on the largest payers, including oil behemoths Royal Dutch Shell and BP which pay dividends that are barely covered by earnings. Due to the vast size of these payments, dividend cover at an aggregate level looks concerning as it is well below the “safe” level of two. However this number isn’t representative of the wider index. Looking at average coverage ratios (payout ratio, free cash flow cover and leverage) are solid enabling future dividend growth. The average and median payout ratio for FTSE All Share companies is expected to be 54% and 47% respectively for the current financial year (FY1), slightly up compared to last year. In the meantime, average free cash flow cover is projected to remain strong at 1.8x (compared to 2x last year) and equity analysts anticipate a reduction in net debt to EBITDA ratio from 1.2x to 1x this year.
To access the report, please contact dividendsupport@markit.com
Payout ratio for FTSE All Share companies
Free cash flow cover
Payout ratio (average and median) by sector
Kevin Soyer, Research & Analysis Associate Director at IHS Markit
Posted 19 January 2018S&P Global provides industry-leading data, software and technology platforms and managed services to tackle some of the most difficult challenges in financial markets. We help our customers better understand complicated markets, reduce risk, operate more efficiently and comply with financial regulation.
This article was published by S&P Global Market Intelligence and not by S&P Global Ratings, which is a separately managed division of S&P Global.
{"items" : [
{"name":"share","enabled":true,"desc":"<strong>Share</strong>","mobdesc":"Share","options":[ {"name":"facebook","url":"https://www.facebook.com/sharer.php?u=http%3a%2f%2fwww.spglobal.com%2fmarketintelligence%2fen%2fmi%2fresearch-analysis%2fwhich-uk-dividends-most-stretched.html","enabled":true},{"name":"twitter","url":"https://twitter.com/intent/tweet?url=http%3a%2f%2fwww.spglobal.com%2fmarketintelligence%2fen%2fmi%2fresearch-analysis%2fwhich-uk-dividends-most-stretched.html&text=Which+UK+dividends+are+most+stretched%3f+%7c+S%26P+Global","enabled":true},{"name":"linkedin","url":"https://www.linkedin.com/sharing/share-offsite/?url=http%3a%2f%2fwww.spglobal.com%2fmarketintelligence%2fen%2fmi%2fresearch-analysis%2fwhich-uk-dividends-most-stretched.html","enabled":true},{"name":"email","url":"?subject=Which UK dividends are most stretched? | S&P Global&body=http%3a%2f%2fwww.spglobal.com%2fmarketintelligence%2fen%2fmi%2fresearch-analysis%2fwhich-uk-dividends-most-stretched.html","enabled":true},{"name":"whatsapp","url":"https://api.whatsapp.com/send?text=Which+UK+dividends+are+most+stretched%3f+%7c+S%26P+Global http%3a%2f%2fwww.spglobal.com%2fmarketintelligence%2fen%2fmi%2fresearch-analysis%2fwhich-uk-dividends-most-stretched.html","enabled":true}]}, {"name":"rtt","enabled":true,"mobdesc":"Top"}
]}