Customer Logins
Obtain the data you need to make the most informed decisions by accessing our extensive portfolio of information, analytics, and expertise. Sign in to the product or service center of your choice.
Customer Logins
COMMENTARY
Jan 18, 2019
Using quotes to measure CRT MBS liquidity trends
Credit Risk Transfer (CRT) mortgage backed securities are typically more liquid than securities in the broader credit MBS market. CRT transactions are specifically structured for a government sponsored entity (GSE), like Fannie Mae or Freddie Mac, to share some of the issue's credit risk with the investor unlike a typical agency CMO with an implicit or explicit government guarantee of principal repayment.
Liquidity, one of several key factors responsible for driving investment returns across all tradable assets, is particularly challenging to quantify for securitized products due to their limited price transparency and the relatively low quote frequencies for individual bonds. Unlike traditional MBS, the actual trade prices of CRTs are reported on TRACE with detail similar to US corporate bonds. The CRT sector and individual bonds' liquidity ebb and flow just like any other asset class, but the infrequency of trades in the sector creates the need for additional factors to properly measure changes in liquidity.
Market participants in more liquid sectors, such as corporate and sovereign bonds, are now optimizing execution by using the deep historical dealer quote datasets to determine sudden shifts in liquidity. Since these quote datasets are also relevant to the CRT market, we reviewed over 2 million parsed quotes and over 3,500 round lot trades, each over $1 million, out of the 105 2017 vintage and older CRT bonds broadly quoted by dealers in 2018. Data from IHS Markit indicates that the most quoted CRT bond in 2018 was the $401 million the Connecticut Avenue Securities, Series 2017-C07 1M2 issue, which was quoted over 38,000 times and at least once every trading day. We note that the decision was made to not include bonds issued in 2018 to minimize data count inconsistencies by restricting the analysis to only bonds that were quotable and tradable the entire year.
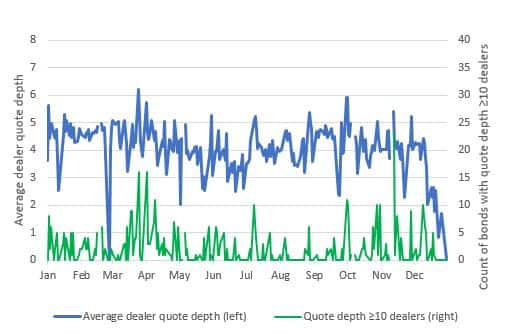
Beyond expected seasonal changes, the daily quote data may be indicating market driven changes to liquidity as evidenced by fluctuations in the number of dealers quoting CRTs. Figure 1 measures the daily average dealer quote depth (number of dealers quoting the same bond on a given day) for all the bonds quoted in 2018. The lower line indicates the number of bonds quoted by 10 or more dealers and can be used as a proxy for CRT bid wanted in competition (BWIC) activity given that most bid lists will trigger multiple dealers sending out at least price talk and in some cases the cover bid for every bond on the list. Outside of the precipitous drop in average dealer depth during the SFIG conference in late-February, the data does indicate an increase in average quote depth and highly quoted bonds in April that gradually declines through early-July. The next sharp increase in average depth occurred in early-October and levelled off until December. Activity was anaemic in December, but it is difficult to determine if this was driven by the typical December holiday slowdown in quoting activity or the severe distress in the global equity markets. It is important to note that we did not include the approximate 150 pre-2018 CRT bonds that were never broadly quoted in 2018; doing so would have lowered the magnitude of the average daily quote depth significantly while still preserving the daily trends.
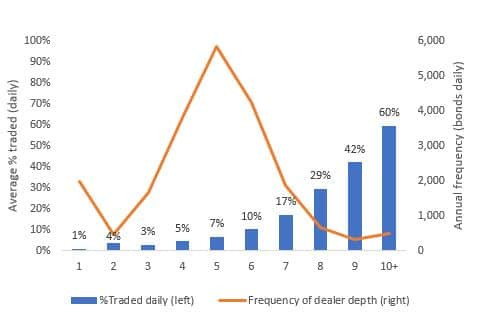
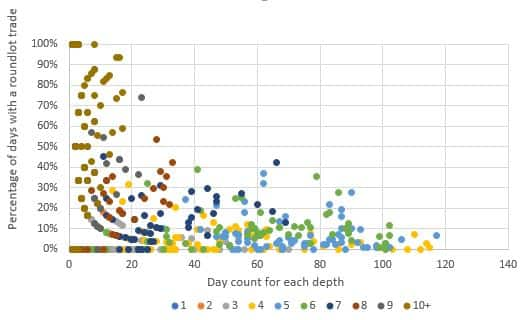
Our analysis also verifies that similar to US corporate and municipal bonds, the likelihood of a bond trading on a given day increases with the number of dealers quoting the bond. Figure 2 shows the average percentage of quoted CRT bonds traded daily versus dealer depth and the frequency of each depth bucket. As expected, the graph clearly highlights that bonds quoted by more dealers have a higher probability of trading; with the caveat that there is a much smaller pool of bonds with 10 or more dealers quoting them on a given day. CRTs have an unusually high number of bonds being quoted by 4-6 dealers, this does not occur when repeating the same type of analysis for US corporate or municipal bonds; and may indicate an unusual herding pattern unique to CRTs, or could be representative of BWICs being used much more in the CRT market. Figure 3 shows CRT mezzanine ('M' tranches) bond level dealer quote depth frequency and percentage versus dealer depth, with each dealer depth category illustrated by a different color marker. That 10+ dealer depth points are probably a good proxy for determining BWIC appearance frequency and what percentage of times those bonds traded when on a list.
There are of course many other more important factors that go into deciding which CRT bond to trade, price, and when to make the trade, but the issue's or sector's current level of dealer participation in the form of quotes should be considered in the decision-making process after reviewing collateral, structural, and relative value factors. Given the infrequency of CRT trading activity, it is important to keep in mind that both the broad and targeted bond quotes you receive every day are indeed one of the best in-house real time barometers of liquidity.
Figure 1: 2018 daily average dealer quote depth and number of bonds quoted by 10 or more dealers for 2017 and earlier CRT mezzanine and subordinate bonds

Figure2: 2018 average percentage of quoted CRT bonds traded (round lot size) daily versus dealer depth and frequency of each depth bucket

Figure 3: 2018 CRT mezzanine bond frequency of dealer depth and percentage traded (round lot size) versus dealer depth

Source: IHS Markit, FINRA
S&P Global provides industry-leading data, software and technology platforms and managed services to tackle some of the most difficult challenges in financial markets. We help our customers better understand complicated markets, reduce risk, operate more efficiently and comply with financial regulation.
This article was published by S&P Global Market Intelligence and not by S&P Global Ratings, which is a separately managed division of S&P Global.
{"items" : [
{"name":"share","enabled":true,"desc":"<strong>Share</strong>","mobdesc":"Share","options":[ {"name":"facebook","url":"https://www.facebook.com/sharer.php?u=http%3a%2f%2fwww.spglobal.com%2fmarketintelligence%2fen%2fmi%2fresearch-analysis%2fusing-quotes-to-measure-crt-mbs-liquidity-trends.html","enabled":true},{"name":"twitter","url":"https://twitter.com/intent/tweet?url=http%3a%2f%2fwww.spglobal.com%2fmarketintelligence%2fen%2fmi%2fresearch-analysis%2fusing-quotes-to-measure-crt-mbs-liquidity-trends.html&text=Using+quotes+to+measure+CRT+MBS+liquidity+trends+%7c+S%26P+Global+","enabled":true},{"name":"linkedin","url":"https://www.linkedin.com/sharing/share-offsite/?url=http%3a%2f%2fwww.spglobal.com%2fmarketintelligence%2fen%2fmi%2fresearch-analysis%2fusing-quotes-to-measure-crt-mbs-liquidity-trends.html","enabled":true},{"name":"email","url":"?subject=Using quotes to measure CRT MBS liquidity trends | S&P Global &body=http%3a%2f%2fwww.spglobal.com%2fmarketintelligence%2fen%2fmi%2fresearch-analysis%2fusing-quotes-to-measure-crt-mbs-liquidity-trends.html","enabled":true},{"name":"whatsapp","url":"https://api.whatsapp.com/send?text=Using+quotes+to+measure+CRT+MBS+liquidity+trends+%7c+S%26P+Global+ http%3a%2f%2fwww.spglobal.com%2fmarketintelligence%2fen%2fmi%2fresearch-analysis%2fusing-quotes-to-measure-crt-mbs-liquidity-trends.html","enabled":true}]}, {"name":"rtt","enabled":true,"mobdesc":"Top"}
]}


