IHS Markit US PMI signals GDP growth rate slowing close to 2.0% in December
- Flash PMI signals weakest growth for one-and-a-half years in December
- PMI indicates GDP growth rate close to 2.5% in Q4, but momentum down to 2.0% towards year end
- IHS Markit survey paints far weaker picture than ISM
Flash PMI™ survey data from IHS Markit show the US economy losing further growth momentum in December. While the latest data rounded off a relatively solid fourth quarter, the surveys indicate that the pace of economic growth has slowed markedly compared to earlier in the year to reach a one-and-a-half year low as the year closes.
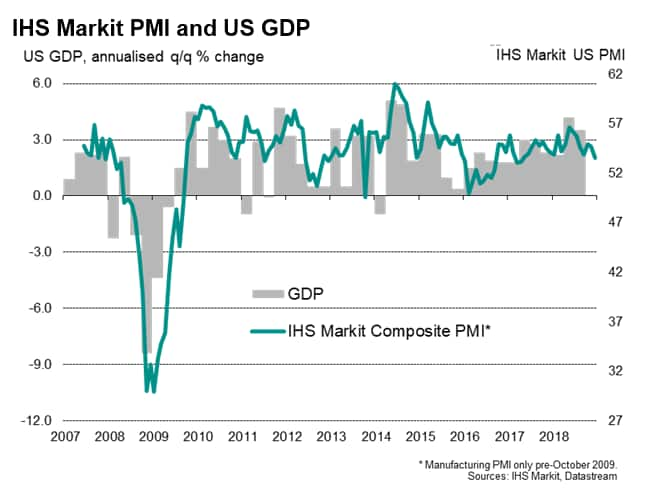
At 53.6 in December, the latest composite PMI output index, which covers both manufacturing and services, fell from 54.7 in November to reach its lowest since May 2017. The index peaked back in May at 56.6.
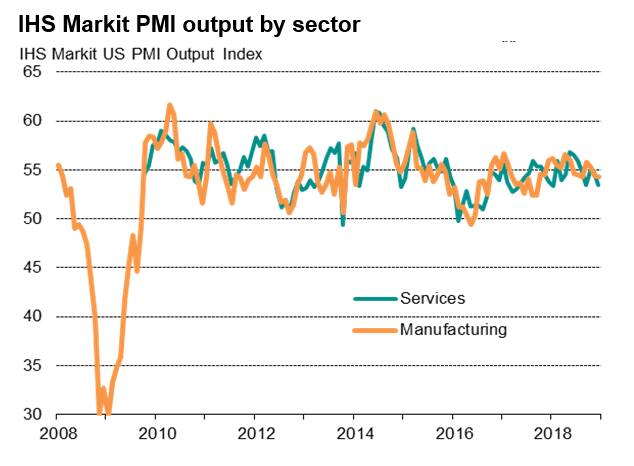
The December slowdown was caused by the weakest service sector expansion since January. Manufacturing output growth remained unchanged on that seen in November, though even that was the joint-smallest factory output rise seen over the past 15 months.
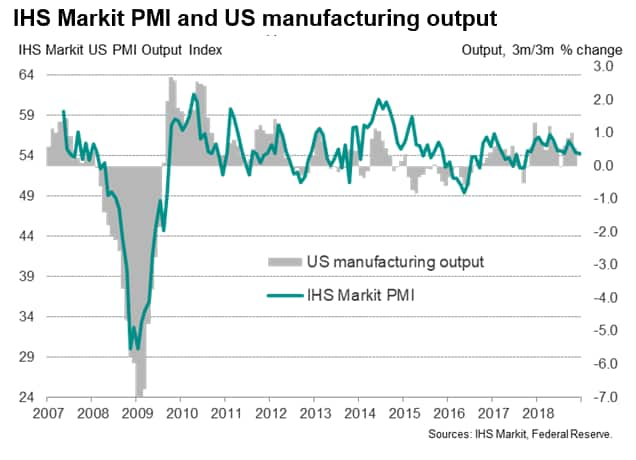
The PMI came on the heels of official data showing manufacturing production to have been flat in November, having declined 0.1% in October. That leaves output running just 0.2% (0.7% annualised) higher in the fourth quarter compared to the third quarter, which is in line with the signal from the IHS Markit PMI manufacturing output index.
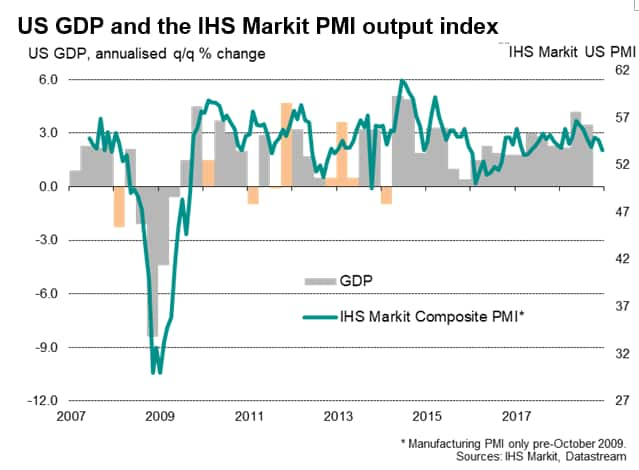
Historical comparisons of the IHS Markit survey data with gross domestic product indicate that the PMI is indicative of the economy growing at an annualised pace of just under 2.5% in the fourth quarter, below the 4.2% and 3.5% rates indicated by the official data for the second and third quarters respectively. However, growth momentum was also lost over the course of the fourth quarter, with the December PMI reading consistent with GDP growth sliding closer to 2.0%.
The survey's forward-looking indicators suggest that momentum is likely to continue to fade as we move into 2019. New order inflows hit the lowest since April of last year and expectations regarding future business growth slipped to the lowest for two-and-a-half years.
The anecdotal evidence collected from survey participants reveal greater caution in relation to spending amid growing uncertainty about the economic outlook, linked in part to growing geopolitical concerns and trade wars.
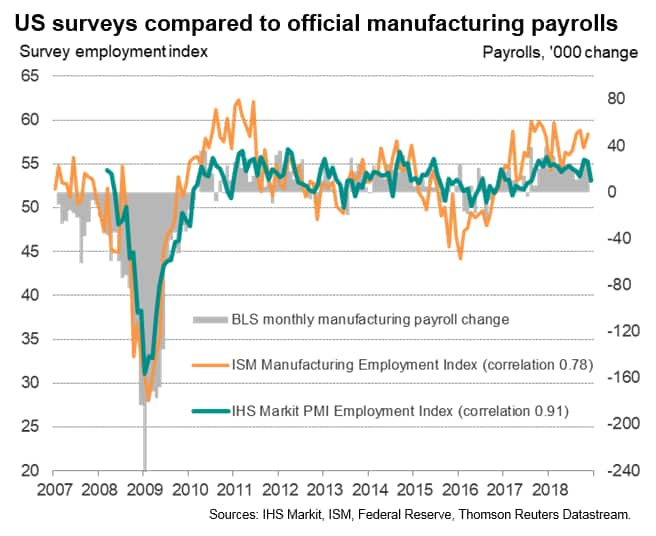
The weaker picture of current and future business growth has also curbed appetite for hiring. Jobs growth inched down to the lowest for one-and-a-half years, according the flash PMI's employment index covering both manufacturing and services, though remained consistent with non-farm payrolls rising in December by around 180,000.
Survey divergence
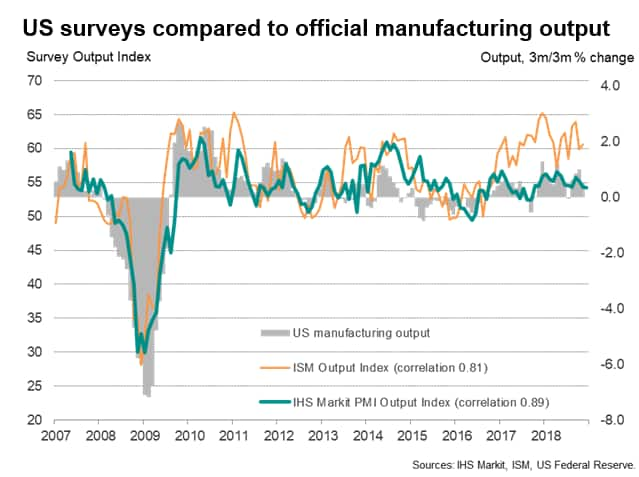
The more subdued pace of expansion signalled by the IHS Markit PMI contrasts with more upbeat business survey data from the ISM. Recent ISM surveys have been indicating a rate of economic growth almost double that signalled by the IHS Markit data the fourth quarter. According to the latest ISM manufacturing survey press release from 3rd December:
"The past relationship between the [ISM] PMI and the overall economy indicates that the PMI for November (59.3 percent) corresponds to a 4.9-percent increase in real gross domestic product (GDP) on an annualized basis."
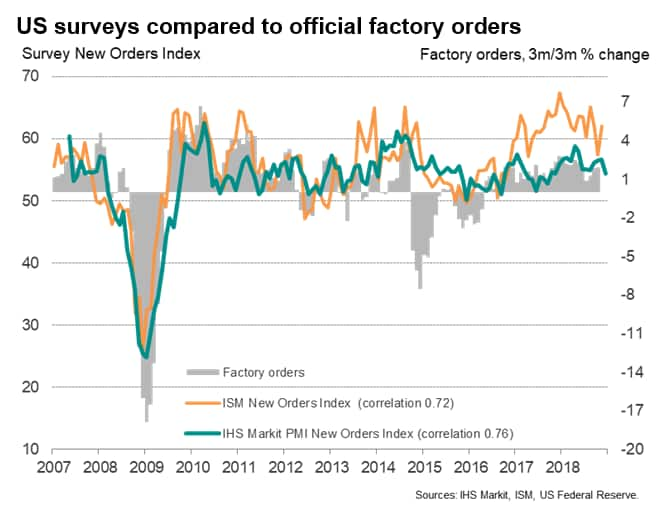
This divergence is nothing new. Like-for-like comparisons of the ISM and IHS Markit manufacturing indices highlight how the ISM survey data have sent far stronger signals than the IHS Markit surveys for variables such as factory production (output) and orders over much of the past two years. The comparisons also suggest that the ISM data have been likewise indicating growth rates far above those of the comparable official economic data in recent years. Such overstatement has not been seen in the IHS Markit data.
Statistical break in ISM series
Further analysis indicates that a structural break is evident in the ISM survey data. A recent paper from economists at Macroeconomic Advisers by IHS Markit uses statistical analysis to demonstrate that the ISM output and new orders indexes have overstated growth of their official corresponding economic concepts to the extent that a statistical break in the relationships likely occurred in June 2017. No such statistical break is evident in the IHS Markit survey, adding confidence to our PMI-based GDP nowcasts.
GDP estimates from the IHS Markit PMI
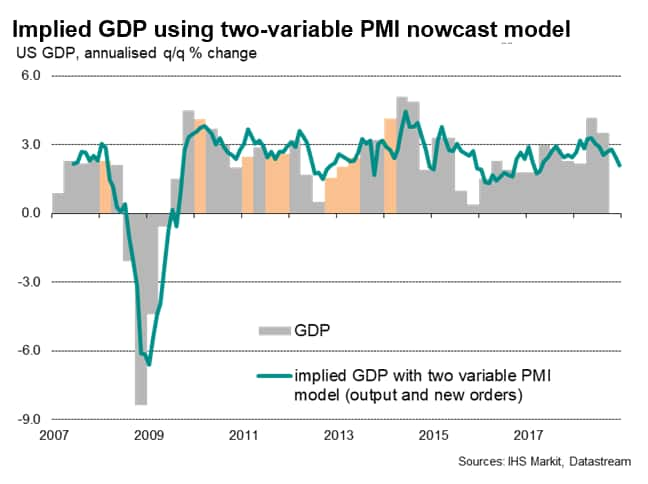
The PMI-based GDP estimates of growth slowing to around 2% in December are derived from a simple 'nowcast' model, which builds on research which uses IHS Markit's sister PMI surveys to estimate UK and Eurozone GDP growth.
IHS Markit PMI data are widely used to nowcast GDP in many economies including the Eurozone and UK by organisations which include central banks. ECB staff describe the "outstanding PMI-based GDP track record" in the euro area with a recent paper highlighting how "a tracker for GDP growth using only the PMI is of similar accuracy for the final GDP release as the first GDP release." Given that the PMI is available well in advance of the first official GDP release, the PMI is consequently extensively used in nowcasting and European policymaking.
With over a decade of history in the US, the IHS Markit PMI can also be used to accurately predict US GDP growth in advance. To highlight this 'nowcasting' value of the PMI, a simple regression is used where the US PMI composite output index (covering both manufacturing and services) is the sole variable used to explain the official US GDP growth rate.
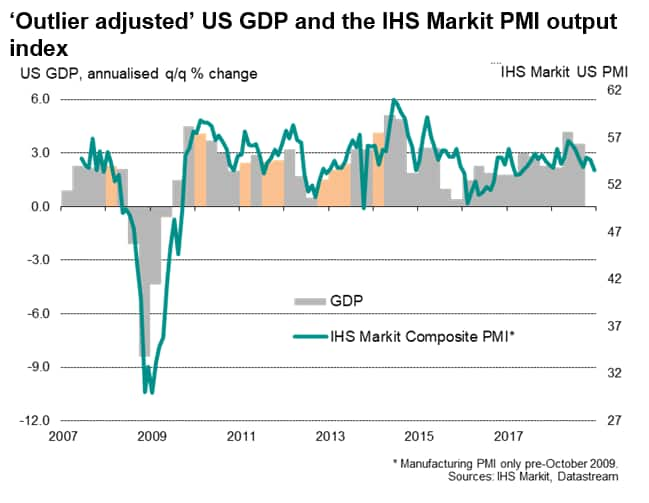
However, GDP has in the past tended to suffer from undue volatility, mainly in the first quarters of each year between 2008 and 2014. This is thought to be due to the official data not fully capturing seasonal influences (depicted by orange bars). The PMI should not be expected to predict such errors and the inclusion of such 'outliers' would only distort the model and resultant GDP estimates.
A solution is to take averages of the GDP for the periods around the suspected 'outliers', as shown in the chart below. This process lifts the correlation of GDP with the PMI from 74% to 86%, therefore improving the model's predictive power for future GDP estimation. The adjusted r-square of the outlier adjusted model is 0.74 against 0.55 without the outliers removed.
Inclusion of the PMI new orders index (as a proxy for sales) alongside the output index in the nowcast model boost the adjusted r-square further to 0.76. Once allowance is made for GDP outliers as described above, the model has provided an advance warning of all turning points in the economy over the past decade as well as providing an accurate guide to GDP growth rates.
For more information contact economics@ihsmarkit.com.
Chris Williamson, Chief Business Economist, IHS
Markit
Tel: +44 207 260 2329
chris.williamson@ihsmarkit.com
© 2018, IHS Markit Inc. All rights reserved. Reproduction in whole or in part without permission is prohibited.
Purchasing Managers' Index™ (PMI™) data are compiled by IHS Markit for more than 40 economies worldwide. The monthly data are derived from surveys of senior executives at private sector companies, and are available only via subscription. The PMI dataset features a headline number, which indicates the overall health of an economy, and sub-indices, which provide insights into other key economic drivers such as GDP, inflation, exports, capacity utilization, employment and inventories. The PMI data are used by financial and corporate professionals to better understand where economies and markets are headed, and to uncover opportunities.
This article was published by S&P Global Market Intelligence and not by S&P Global Ratings, which is a separately managed division of S&P Global.

