Customer Logins
Obtain the data you need to make the most informed decisions by accessing our extensive portfolio of information, analytics, and expertise. Sign in to the product or service center of your choice.
Customer Logins
ECONOMICS COMMENTARY
Sep 18, 2018
US manufacturing surveys send diverging signals
- Manufacturing output rises a mere 0.2% in three months to August, corroborating IHS Markit PMI
- Strong ISM growth signals potentially reflect outperformance by larger companies
Different surveys offer differing views on the health of the US manufacturing economy. The widely-watched ISM gauge of the health of the goods-producing sector rose to a 14-year high of 61.3 in August, extending a run of super-strong growth that has been indicated by the surveys for over a year. In contrast, at 54.7 the IHS Markit PMI survey paints a picture of a more subdued manufacturing sector, albeit one still enjoying reasonably solid growth.
Ascertaining which survey is sending the correct signal is important: although manufacturing only accounts for around 12% of US GDP, it remains an important bellwether of the wider economy. ISM and PMI manufacturing indices therefore often form important components of 'nowcast' models, which attempt to measure the current rate of economic growth. False signals on the health of the factory sector can therefore prove costly to investors, businesses and policymakers.
With official data for manufacturing output now available for August, we can get a better idea of which survey is providing the best signal of actual production trends. The official data, produced by staff at the Federal Reserve, showed production rising by a disappointing 0.2% in August following a 0.3% rise in July and a more impressive 0.7% gain in June.
As the monthly data can be volatile, it's also useful to look at the trend, which is commonly assessed by using the change in output in the latest three months compared to the prior three months. On this basis, output was up 0.5% in the three months to August.
To compare survey performance, we use the ISM and PMI survey output indices rather than the headline survey numbers (which are aggregates of various survey sub-indices), which are charted here against the three-month-on-three-month change in the official data.
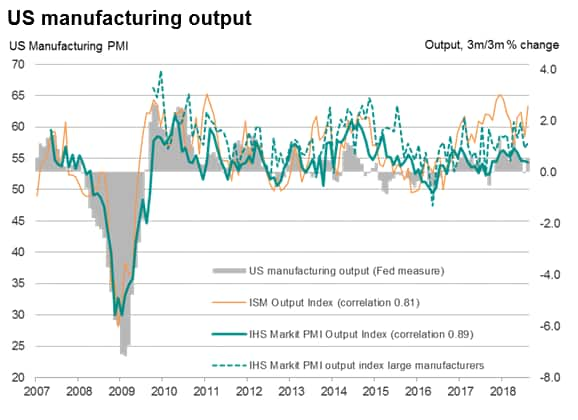
How did the surveys compare? A simple OLS regression suggests that the latest ISM output index was indicative of 1.6% growth in the official August three-month-on-three-month measure of manufacturing production, so overestimating the official growth trend by some margin, whereas a growth rate of just over 0.2% was indicated by the PMI.
The comparisons show that over the past decade the correlation of the ISM output index with the official gauge is a strong 0.81, but the PMI has a higher 0.89 correlation. The relatively better fit of the PMI with the official data is especially notable in the past two years, a period in which the ISM has tended to substantially overestimate official growth rates.
Over the past year, the average signal from the ISM was for 1.3% growth compared to just 0.3% for the PMI. By comparison, the official growth rate over this period has averaged 0.5%, therefore far closer to the PMI than the ISM.
ISM divergence extends beyond output
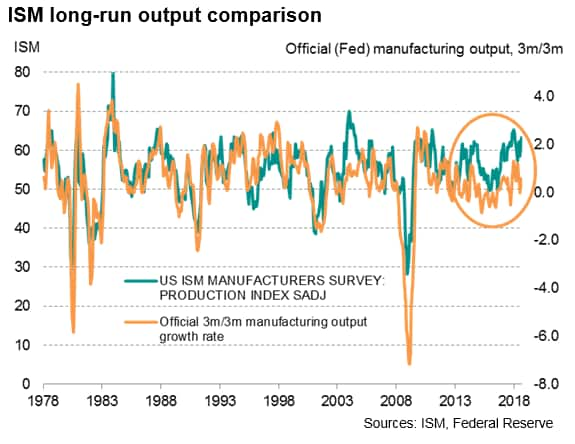
The overestimation of manufacturing growth by the ISM is unusual. Historical comparisons suggest that up to 2013-14 the survey provided an accurate advance guide to official data, but that the relationship appears to have since broken down, especially since mid-2016 (see chart).
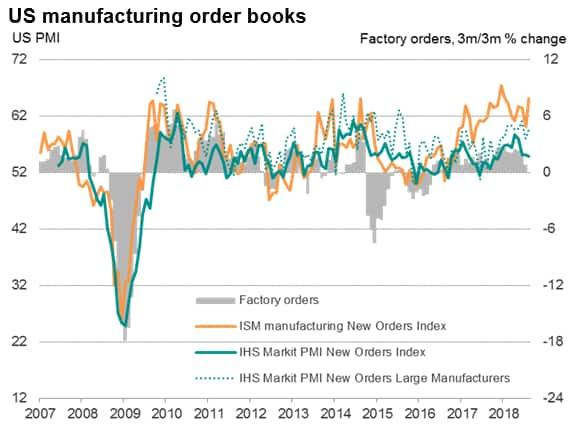
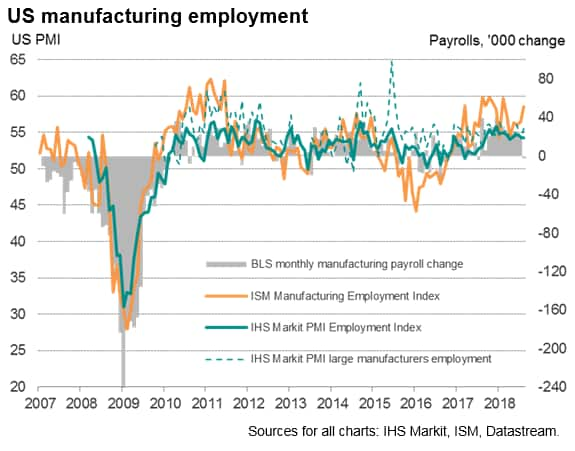
The recent overestimation of growth by the ISM is also not restricted to manufacturing output. Comparisons with factory orders and employment show similar breakdowns of the survey's predictive powers, with the PMI tending to offer a more reliable (and more subdued) picture of the sector's recent health in both cases.
Explaining the divergence
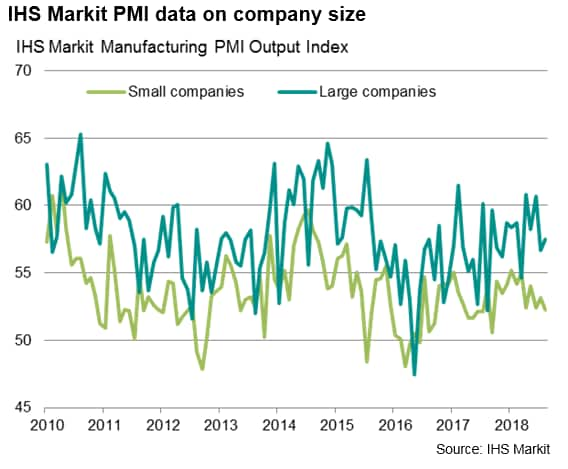
As yet, there is no clear explanation of the divergence between the ISM with the PMI and official numbers, but an analysis of the PMI data suggests company size may be a factor. Specifically, the ISM panel comprises only very large companies whereas the IHS Markit PMI is based on a carefully constructed panel that replicates the manufacturing economy according to an analysis of official data on industry sector and company size. As such, the PMI ensures small, medium and large companies are appropriated represented in the IHS Markit survey results each month. With the PMI data showing large companies to have significantly outperformed smaller firms in recent months, extrapolation suggests that the very large firms covered by the ISM may well have been performing even better, hence the surprisingly strong ISM readings.
Chris Williamson, Chief Business Economist, IHS
Markit
Tel: +44 207 260 2329
chris.williamson@ihsmarkit.com
© 2018, IHS Markit Inc. All rights reserved. Reproduction in whole or in part without permission is prohibited.
Purchasing Managers' Index™ (PMI™) data are compiled by IHS Markit for more than 40 economies worldwide. The monthly data are derived from surveys of senior executives at private sector companies, and are available only via subscription. The PMI dataset features a headline number, which indicates the overall health of an economy, and sub-indices, which provide insights into other key economic drivers such as GDP, inflation, exports, capacity utilization, employment and inventories. The PMI data are used by financial and corporate professionals to better understand where economies and markets are headed, and to uncover opportunities.
This article was published by S&P Global Market Intelligence and not by S&P Global Ratings, which is a separately managed division of S&P Global.
{"items" : [
{"name":"share","enabled":true,"desc":"<strong>Share</strong>","mobdesc":"Share","options":[ {"name":"facebook","url":"https://www.facebook.com/sharer.php?u=http%3a%2f%2fwww.spglobal.com%2fmarketintelligence%2fen%2fmi%2fresearch-analysis%2fus-manufacturing-surveys-send-diverging-signals-181918.html","enabled":true},{"name":"twitter","url":"https://twitter.com/intent/tweet?url=http%3a%2f%2fwww.spglobal.com%2fmarketintelligence%2fen%2fmi%2fresearch-analysis%2fus-manufacturing-surveys-send-diverging-signals-181918.html&text=US+manufacturing+surveys+send+diverging+signals+%7c+S%26P+Global+","enabled":true},{"name":"linkedin","url":"https://www.linkedin.com/sharing/share-offsite/?url=http%3a%2f%2fwww.spglobal.com%2fmarketintelligence%2fen%2fmi%2fresearch-analysis%2fus-manufacturing-surveys-send-diverging-signals-181918.html","enabled":true},{"name":"email","url":"?subject=US manufacturing surveys send diverging signals | S&P Global &body=http%3a%2f%2fwww.spglobal.com%2fmarketintelligence%2fen%2fmi%2fresearch-analysis%2fus-manufacturing-surveys-send-diverging-signals-181918.html","enabled":true},{"name":"whatsapp","url":"https://api.whatsapp.com/send?text=US+manufacturing+surveys+send+diverging+signals+%7c+S%26P+Global+ http%3a%2f%2fwww.spglobal.com%2fmarketintelligence%2fen%2fmi%2fresearch-analysis%2fus-manufacturing-surveys-send-diverging-signals-181918.html","enabled":true}]}, {"name":"rtt","enabled":true,"mobdesc":"Top"}
]}


