Featured Topics
Featured Products
Events
S&P Global Offerings
Featured Topics
Featured Products
Events
S&P Global Offerings
Featured Topics
Featured Products
Events
S&P Global Offerings
Featured Topics
Featured Products
Events
Financial and Market intelligence
Fundamental & Alternative Datasets
Government & Defense
Banking & Capital Markets
Economy & Finance
Energy Transition & Sustainability
Technology & Innovation
Podcasts & Newsletters
Financial and Market intelligence
Fundamental & Alternative Datasets
Government & Defense
Banking & Capital Markets
Economy & Finance
Energy Transition & Sustainability
Technology & Innovation
Podcasts & Newsletters
BLOG — Apr 07, 2021

By Alice Gladen
Using our Macroeconomic trade data to look at the impact of Brexit, the UK trade deals made so far and the prospects for the future.
After a long, multi-year process, the UK finally left the EU in January 2021 with the EU-UK Trade and Cooperation Agreement. Along with this deal, the UK had also agreed deals to continue trading as normal with 63 of the 70 non-EU countries with whom trade was previously covered for the UK by EU trade deals (Learn more). Any countries with deals not rolled over ended on 31 December and are now subject to WTO terms.
Beyond the deal with the EU and the agreement to roll over some existing agreements, the government has been engaged in many negotiations surrounding new trade deals. Other deals signed to date include:
Key deals that are being negotiated currently include Mexico, India, US, New Zealand & Australia.
First Month Post BREXIT
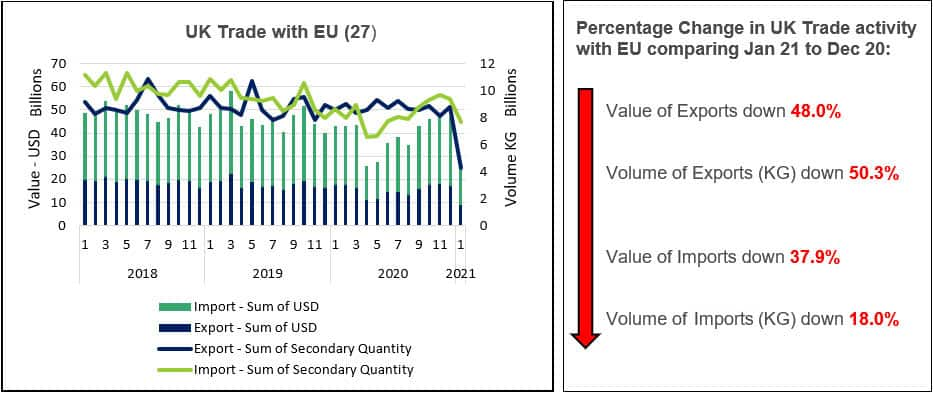
January was the first month of trade after the exit from the EU. The news headlines at the start of March spoke of shock 40% drop in the value of UK exports to the EU as border checks slowed down trade. UK trade statistics reveal the true extent of this decline.
Source: IHS Markit Global Trade Atlas
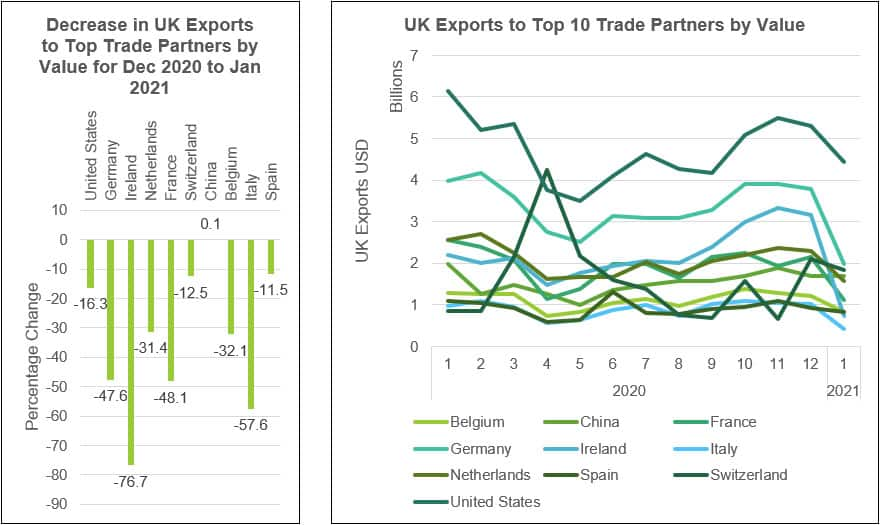
From analysing UK HMRC customs data, we see significant drops in UK trade with the EU in January 2021. Exports are down almost 50% with imports also substantially hit. Looking at the UK's Top Ten Export partners by value in 2020 we can see all of them, except for China, have been hit with decreases in trade.
Source: IHS Markit Global Trade Atlas
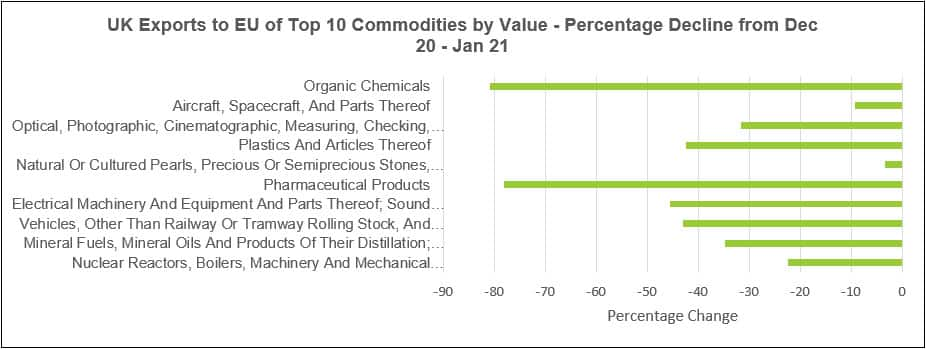
Looking at the commodities, and hence industries, most affected by this drop we can see serious impacts across many industries. When looking at the Top Ten commodities in terms of value exported from the UK to the EU in 2020, there are significant declines across all sectors, with Organic Chemicals and Pharmaceutical Products having the highest declines at over 80 and 78% respectively.
Source: IHS Markit Global Trade Atlas
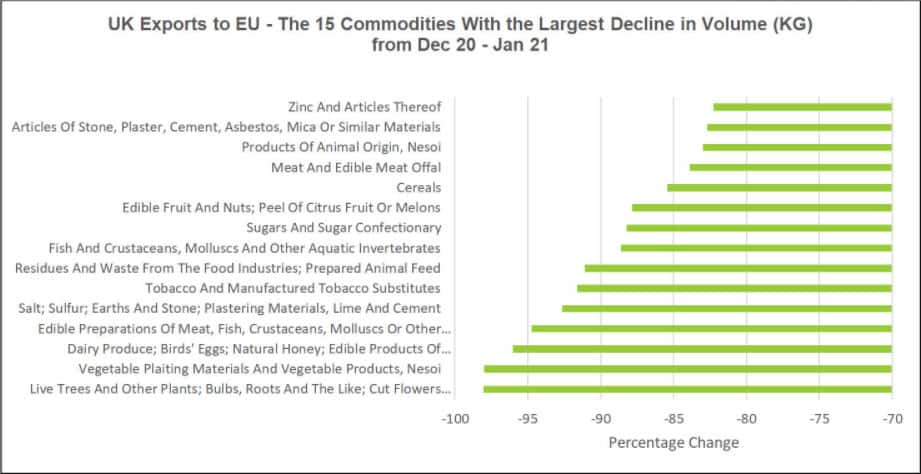
The commodities showing the highest drop in volume from December 2020 to January 2021 are shown below. We observe a significant drop in volumes of UK exports of a range of agricultural products such as Dairy Produce, Meat and Fish products and Cereals.
Source: IHS Markit Global Trade Atlas
There is some positive news as some countries showed increases from December to January. For Example, the UK showed increases in exports to Cambodia, Ghana, Mozambique, Nigeria, Panama, and Vietnam. Additionally, the flurry of trade deals signed by the UK represent significant opportunities for both UK imports and exports. The deals with Japan, Canada, Kenya, Ghana, Cameroon, and Albania represented $41 Billion in trade in 2020.The deal currently being sought with the CPTPP represented $81 Billion in trade in 2020. Deals with India and the US represented $11 Billion and $114 Billion respectively in 2020. The top commodities by value for trade between the UK and these countries are shown below.
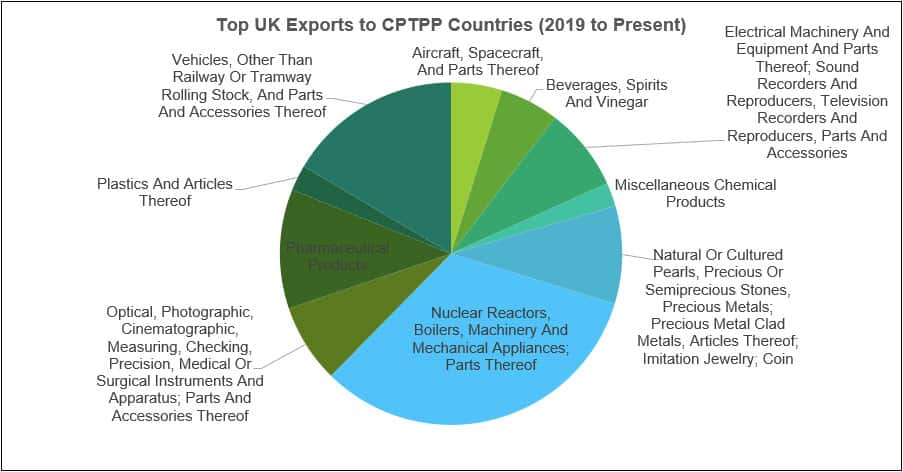
Source: IHS Markit Global Trade Atlas
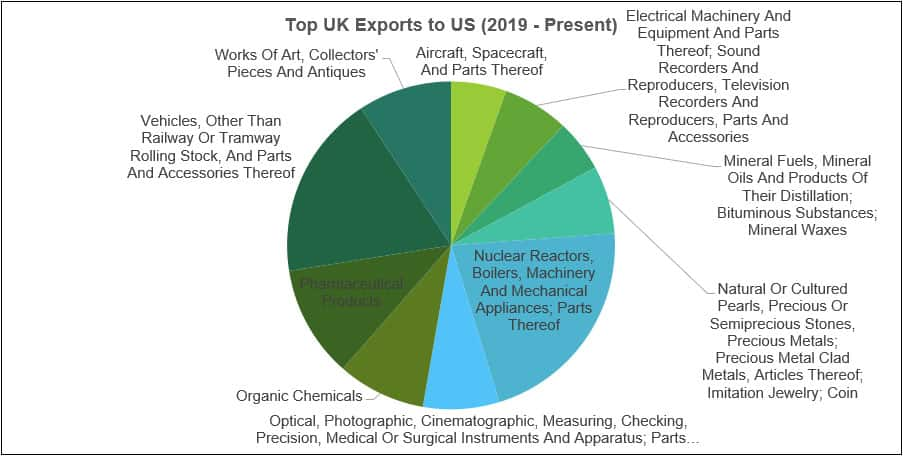
Source: IHS Markit Global Trade Atlas
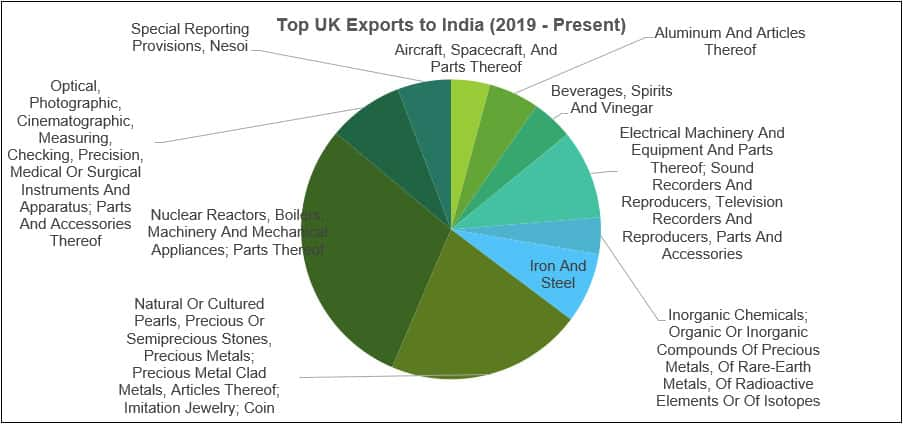
Source: IHS Markit Global Trade Atlas
As we look forward, UK trade with countries outside of the EU may become more important. The graph below shows that UK trade with non-EU countries did not suffer the same drastic drops in January 2021 as trade with EU. If the trade with the EU continues to struggle in 2021, it will be interesting to observe whether trade with non-EU countries shows a growth to fulfil this deficit.
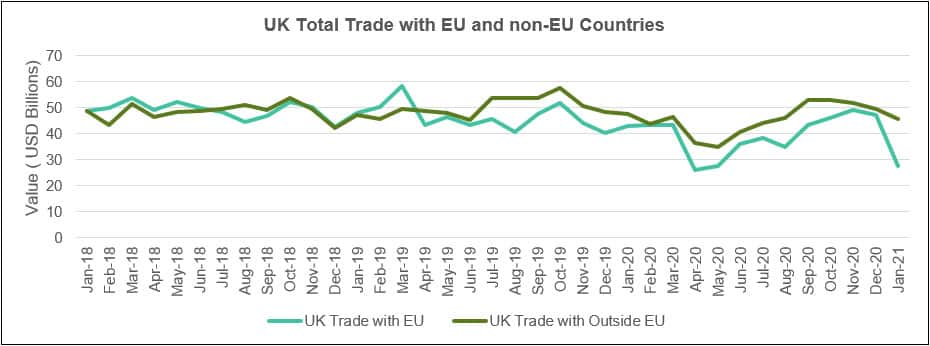
Source: IHS Markit Global Trade Atlas
Subscribe to our monthly newsletter and stay up-to-date with our latest analytics
[i] https://www.gov.uk/government/news/uk-and-japan-sign-free-trade-agreement
[ii] https://www.gov.uk/government/news/uk-applies-to-join-huge-pacific-free-trade-area-cptpp
[iii] https://www.gov.uk/government/news/uk-and-kenya-sign-trade-agreement
[iv] https://www.gov.uk/government/news/uk-signs-trade-partnership-agreement-with-ghana
[v] https://www.gov.uk/government/news/uk-and-cameroon-sign-trade-agreement#:~:text=Today%20(9%20March%202021)%20the,Albert%20Fotabong%20Njoteh%20in%20London.
[vi] https://www.gov.uk/government/publications/continuing-the-uks-trade-relationship-with-albania-parliamentary-report/continuing-the-united-kingdoms-trade-relationship-with-albania-web-version
[vii] https://www.international.gc.ca/trade-commerce/trade-agreements-accords-commerciaux/agr-acc/cuktca-acccru/read_agreement-consultez_accord.aspx?lang=eng
Posted 07 April 2021 by Alice Gladen, Consultant, Chemical Consulting, S&P Global Commodity Insights
How can our products help you?