Featured Topics
Featured Products
Events
S&P Global Offerings
Featured Topics
Featured Products
Events
S&P Global Offerings
Featured Topics
Featured Products
Events
S&P Global Offerings
Featured Topics
Featured Products
Events
Financial and Market intelligence
Fundamental & Alternative Datasets
Government & Defense
Banking & Capital Markets
Economy & Finance
Energy Transition & Sustainability
Technology & Innovation
Podcasts & Newsletters
Financial and Market intelligence
Fundamental & Alternative Datasets
Government & Defense
Banking & Capital Markets
Economy & Finance
Energy Transition & Sustainability
Technology & Innovation
Podcasts & Newsletters
EQUITIES COMMENTARY — May 24, 2024

By Matt Chessum
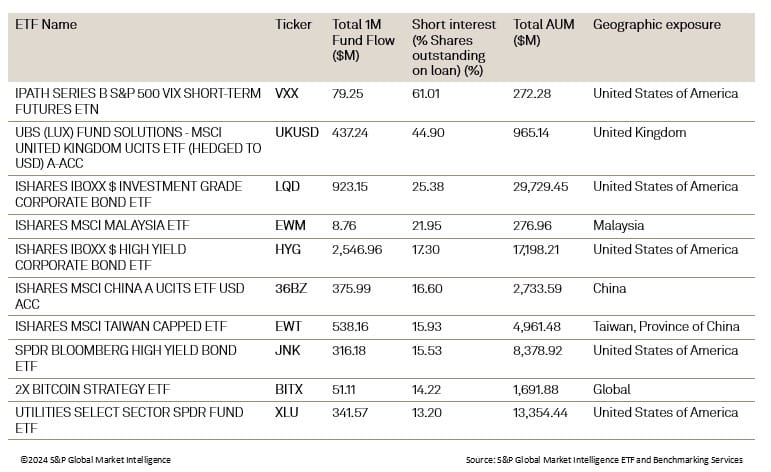
Over the last month, the top ten most shorted ETFs have attracted Inflows of $5.6B. As contrarian views on the future of the global economy and the timing of any change in interest rates continues to play out across the financial media, it appears that investors remain divided as to the direction of movement in certain financial markets.
Fund flow data for 1 month 04/23/24 - 05/22/24 and Short Interest and AUM data as of 05/22/24:

Across the top ten most shorted ETFs, a number of common themes can be seen. As equity markets in the US continue to set record highs, investors appear to expect the bull market to continue as VXX, the IPATH Series B S&P500 VIX Short-term futures ETF, remains the most heavily shorted ETF (the VIX generally has an inverse relationship to the S&P500) with 61% of its outstanding shares being borrowed. Outside of the US, investors appear to be less convinced by recent increases across other equity markets such as the UK, Malaysia, Taiwan, and China as ETFs with underlying exposure to these countries experience elevated levels of short interest. XLU, the Utilities Select Sector SPDR ETF, continues to be a target for short sellers as interest rates remain at multi-decade highs, increasing the cost of capital across the utility sector. Uncertainty regarding future interest rate moves, refinancing walls and on-going spread compression continues to generate uncertainty for investors of corporate bonds which continues to be reflected by the presence of LQD, HYG and JNK in the most shorted ETF table.

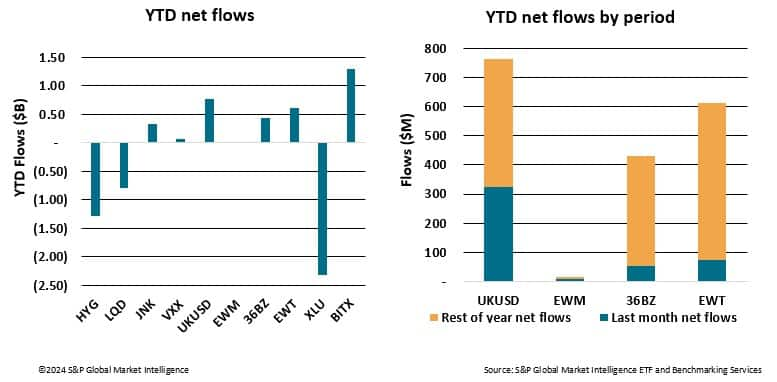
Despite the elevated levels of short interest seen across these ETFs, there does appear to be a conflicting signal in the data, as one-month flows have remained positive. However, when looking at flows on a year-to-date basis a slightly different story can be seen. Year-to-date flows have been negative for HYG, LQD and XLU as interest rate uncertainty continues to impact fundamentals. Year-to-date inflows can be seen in BITX, UKUSD, 36BZ and EWT as these asset classes have experienced substantial increases in valuations over the year attracting further investment. Given the elevated levels of short interest, some investors may now be anticipating a halt to further increases in valuations across these markets. When looking at the proportion of inflows that have taken place over the last month into EWM, 36BZ and EWT, these appear to be relatively muted when compared with the total year-to-date inflows. A slowdown in flows coupled with an increased level of short interest may suggest a rise in negative sentiment across these asset classes.
In the current market environment where conflicting data often adds a greater level of complexity to understanding market sentiment, ETF flow data and securities finance short interest data remain key to understanding investor behavior. Whether the data highlights contrarian opportunities for investors, an inflection point in market sentiment, or further uncertainty and volatility, by analyzing these two data sets together, investors and analysts can gain a nuanced understanding of market sentiment, helping to form investment decisions and strategies in a more effective manner.
S&P Global provides industry-leading data, software and technology platforms and managed services to tackle some of the most difficult challenges in financial markets. We help our customers better understand complicated markets, reduce risk, operate more efficiently and comply with financial regulation.
This article was published by S&P Global Market Intelligence and not by S&P Global Ratings, which is a separately managed division of S&P Global.