S&P Global Offerings
Featured Topics
Featured Products
Events
S&P Global Offerings
Featured Topics
Featured Products
Events
S&P Global Offerings
Featured Topics
Featured Products
Events
Banking & Capital Markets
Economy & Finance
Energy Transition & Sustainability
Technology & Innovation
Podcasts & Newsletters
Banking & Capital Markets
Economy & Finance
Energy Transition & Sustainability
Technology & Innovation
Podcasts & Newsletters
S&P Global Offerings
Featured Topics
Featured Products
Events
BLOG — Nov 02, 2021
By Tomasz Brodzicki, Ph.D.
Key findings
Introduction
The electronics industry is today one of the largest and key global industries. Contemporary society uses a vast array of electronic devices built in automated or semi-automated factories. Products are primarily assembled from metal-oxide-semiconductor (MOS) transistors and integrated circuits (IC), the latter principally produced by photolithography and often on printed circuit boards in wafer fabs. The central driving force behind the entire electronics industry is the semiconductor industry sector, with sales exceeding USD 500 billion yearly. Electronics has a high-tech profile, is very knowledge and R&D intensive, and is characterized by high entry costs (high capital intensity).
The electronics industry consists of several key components, including:
The present article aims to identify the role of East and Southeast Asia economies in the global value chain in electronics using the data available in the IHS Markit Global Trade Analytics Suite (GTAS), primarily data reported by individual states from IHS Markit Global Trade Atlas (GTA), as well as forecast from the IHS Markit GTAS Forecasting database.
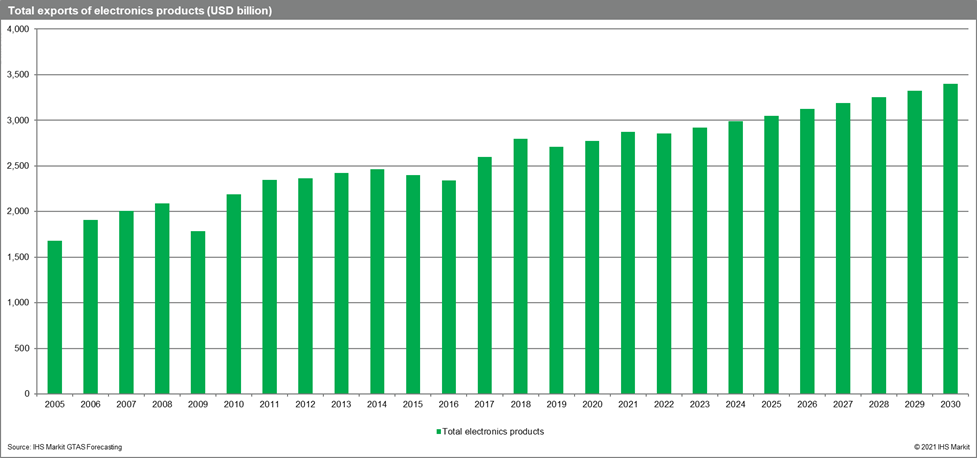
The value of global exports of electronic products (with the semiconductor industry being a part of it) according to GTAS Forecasting is predicted to reach USD 2,885 billion in 2021 and grow to USD 3,397 billion in 2030 with CAGR over 2022-30 exceeding 2.1 percent.
As we can see, the electronic industry has several key hubs with the particular role played by the economies of East and Southeast Asia. The zoom into the region shows the complexity of links.
Global trade in electronic components (Q2 2021)

Source: IHS Markit Global Trade Atlas(GTA). Flows above USD 25 million in Q2 2021.
Global trade in electronic components (Q2 2021) Zoom into East & Southeast Asia
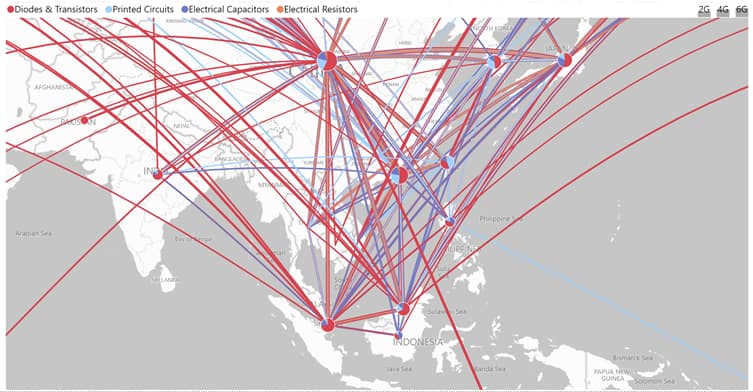
Source: IHS MarkitGlobal Trade Atlas(GTA). Flows above USD 25 million in Q3 2021.
Semiconductors
According leading analyst, the installed capacity of semiconductor integrated circuits (ICs) worldwide is projected to reach 22.7 million of 200mm equivalent wafers per month as of December 2021, an increase of nearly two million over December 2020. It thus represents an increase of global capacity by 9 percent.
The leaders of wafer capacity include Samsung (South Korea), TSMC (Taiwan), Micron (USA), SK Hynix (South Korea), and Kioxia/WD (Japan), with more than half of global capacity. The remaining top 10 have lower capacities - Intel, UMC, GlobalFoundries, Texas Instruments, and SMIC.
Using the information on the location of semiconductor producers globally, we have developed the map indicating a significant role of the East and Southeast Asia region with other important concentrations in Europe and throughout the United States. The zoom into the region points to several key concentrations in Japan, Taiwan, and South Korea. Plants within China are more evenly spread around. At this stage of development, Taiwan hosts the most significant number of wafers fabs globally.
Location of the semiconductor production facilities globally and in the ESEA region


Source: Own elaboration based on processed data from en.wikipedia.org/wiki/ List_of_semiconductor_fabrication_plants accessed on 10/20/2021.

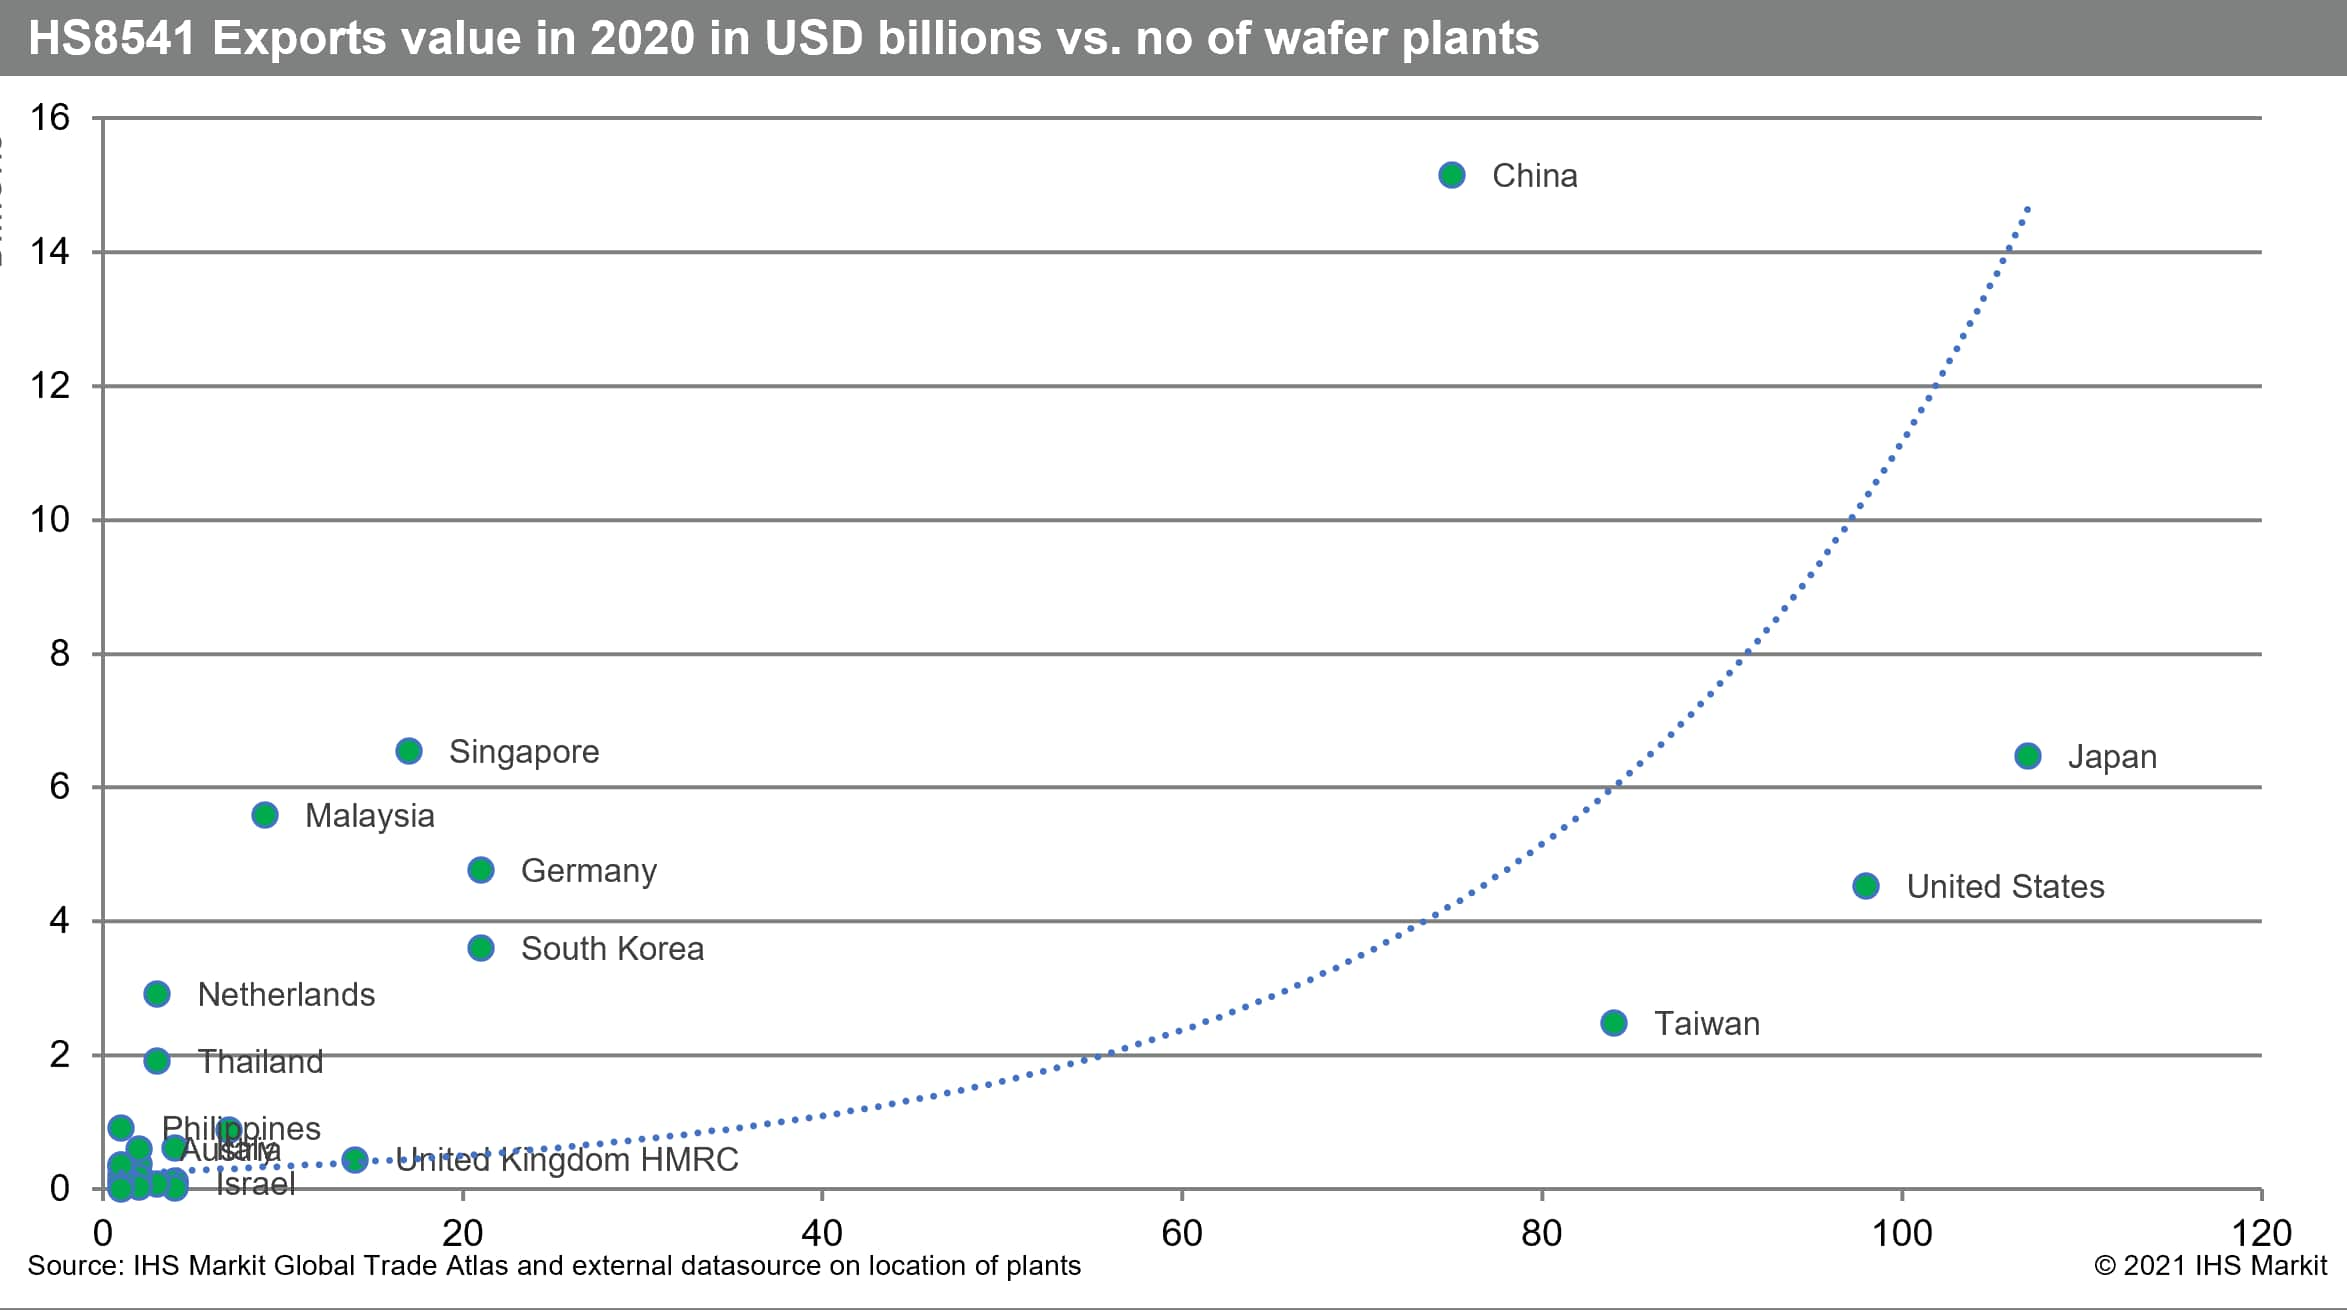
If we look at the GTA data for HS8541 (Diodes, transistors and similar devices, …, semiconductors), we can see that the exports value of most EASA-11 states (Macao SAR not shown, is not reporting trade in HS8541) in 2021 is significantly higher than in 2020. Thus, the shortages could be attributed to significantly higher demand and insufficient production capacities within the region and worldwide.
The location data are correlated with exports data in GTA as can be seen in the following chart using the exports data for 2020.
The role of airborne trade
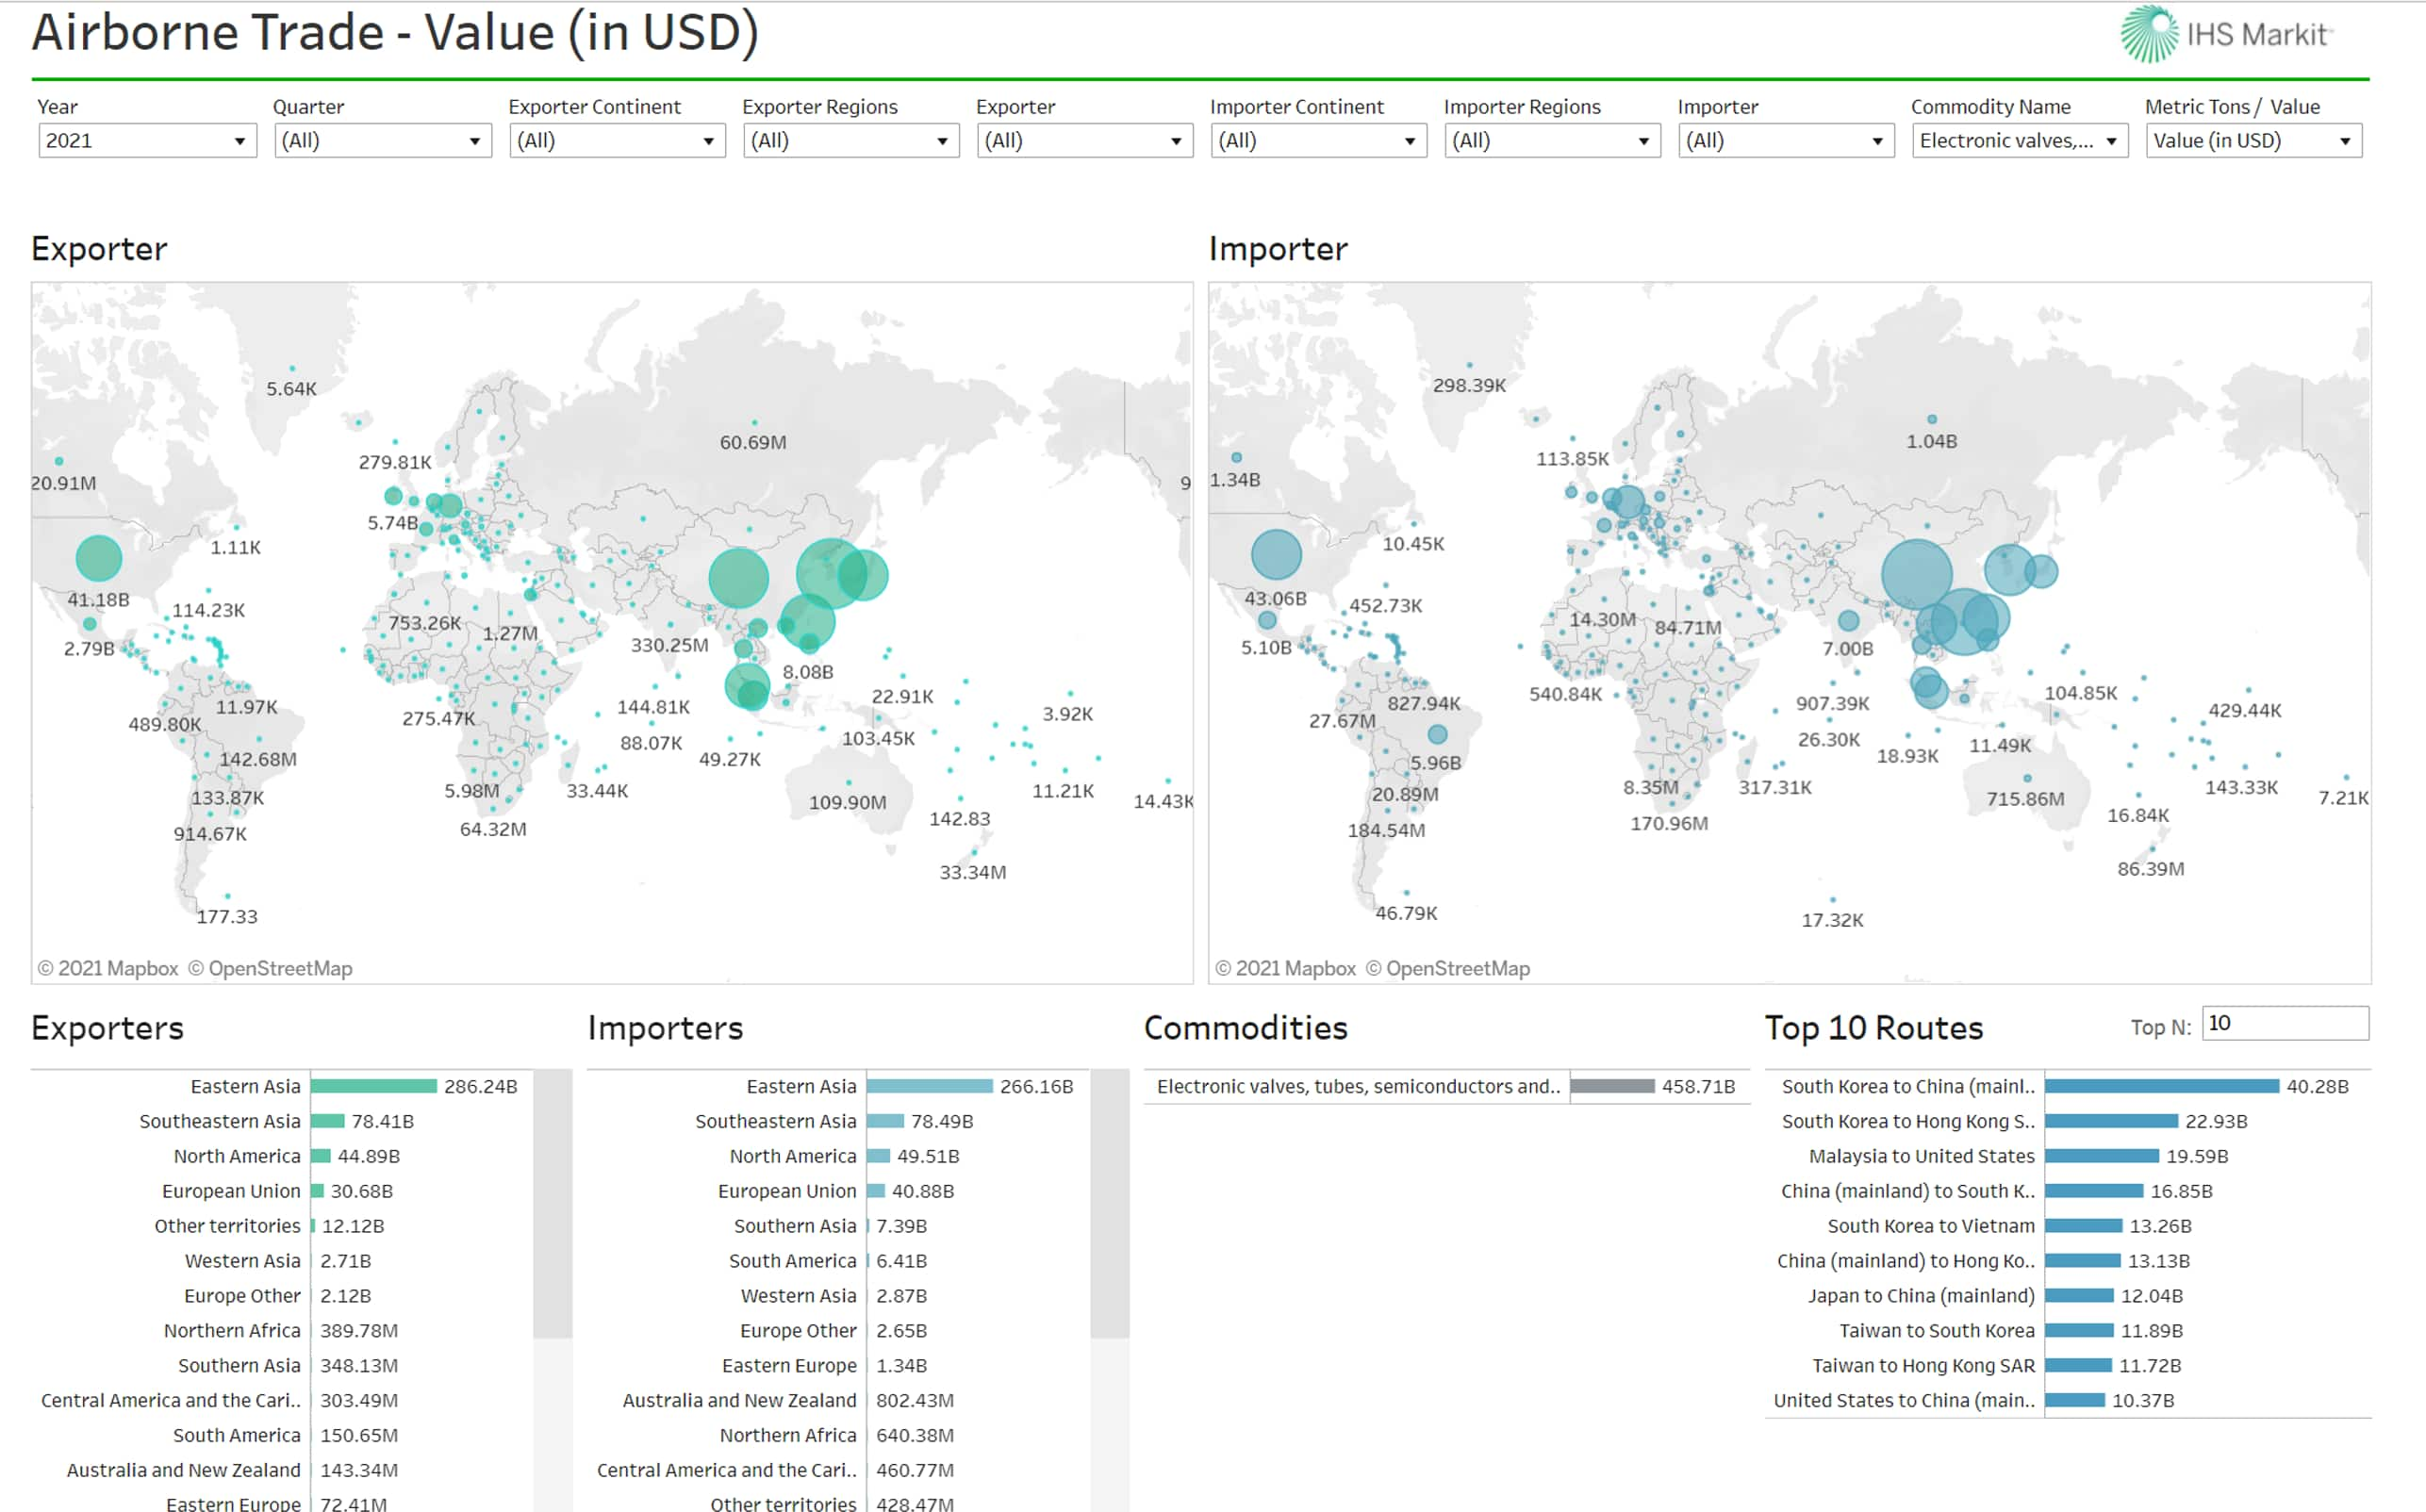
A specific feature of the global electronics industry is that most products are shipped by air. It applies in particular to the production of semiconductors. Using the GTAS Forecasting analytics dashboard for airborne trade, we can observe that the major global exporters of semiconductors are located in eastern and southeastern Asia and North America. The list of the largest importers is the same. Major flows happened between countries and territories of Eastern and Southeast Asia and the United States. The biggest importers in Europe are Germany, the UK, the Netherlands, and France.
Global trade in electronic components - semiconductors transported by air (Q2 2021)
Source: IHS MarkitGTAS ForecastingAnalytics Dashboard.
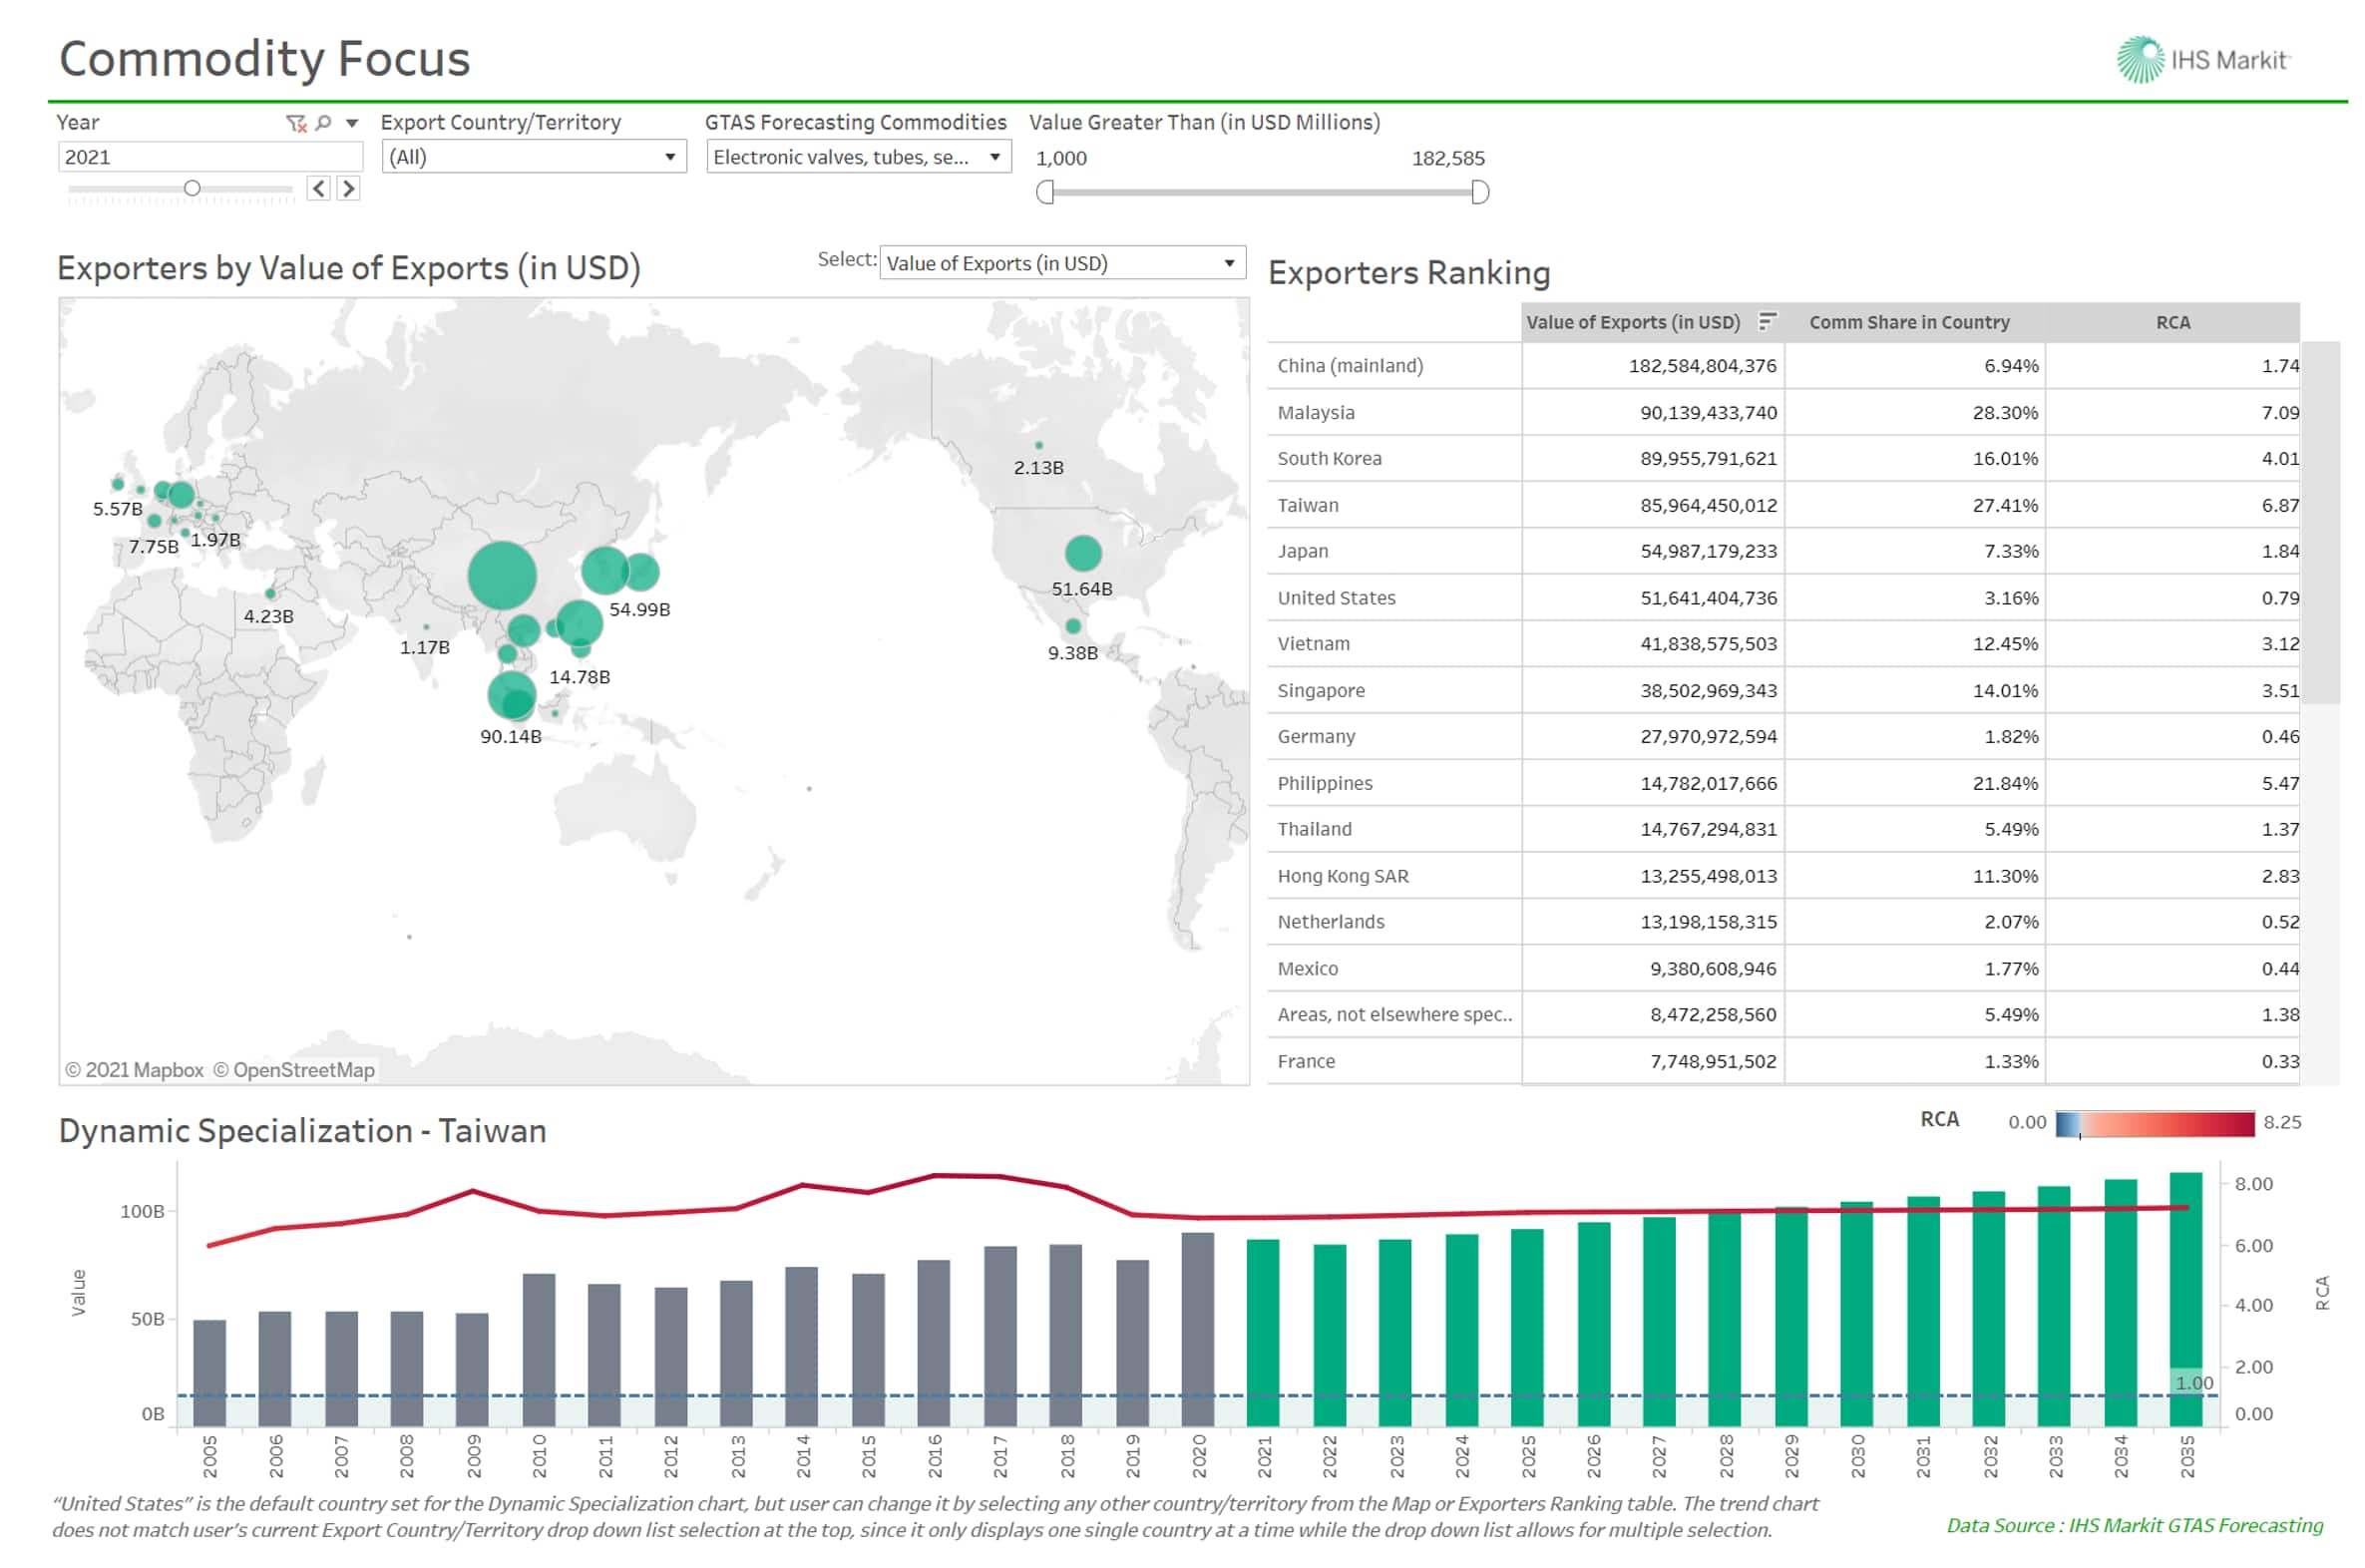
Lets' concentrate on exports of electronic parts, including semiconductors, in terms of value in 2021. The top five exporters from the region include mainland China, Malaysia, South Korea, Taiwan, and Japan. Their exports value in 2021 surpasses the export value of electronic parts, including semiconductors from the United States.
Global trade in electronic components in 2021
Source: IHS MarkitGTAS, Export Specialization Dashboard.
Share of the region in the global exports of electronic components
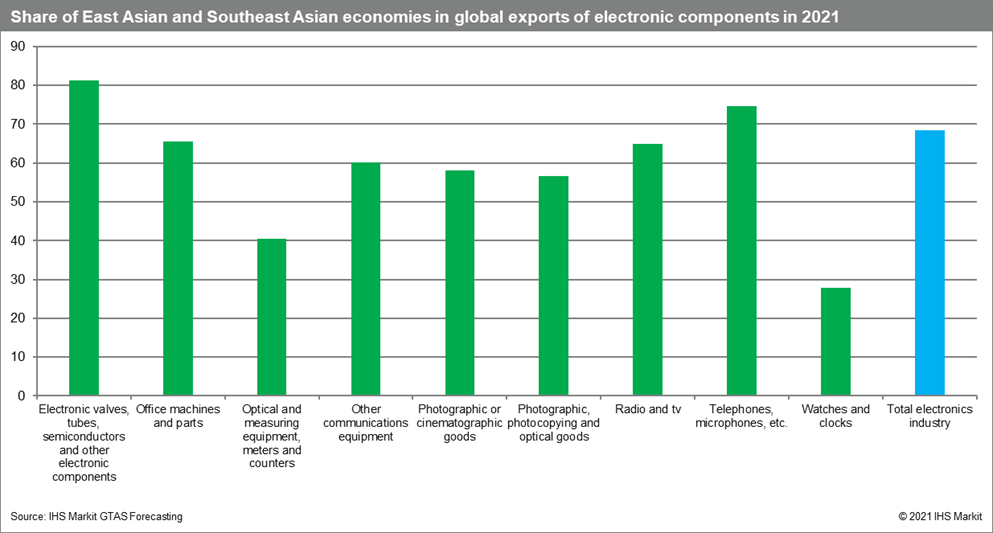
The 11 states of eastern and southeastern Asia (ESEA-11) in total are responsible for 68.4% of global production exports of electronic parts with the top five positions taken by mainland China (32.7% of worldwide exports), followed by Taiwan and South Korea responsible for 7.4% and 6.0% of global exports, respectively. We predict that the situation is not going to change in the short-run future 2022-2023.

If we look at the exports from the region from a product perspective, the region's role is the most significant in electronic components and telephones and exceeds 70%. The region has the lowest share in optical and measuring equipment, 40%, and watches and clocks around 30% of global exports. It is nevertheless still significant.Source: IHS Markit GTAS Forecasting.
Growth rates are higher in the region
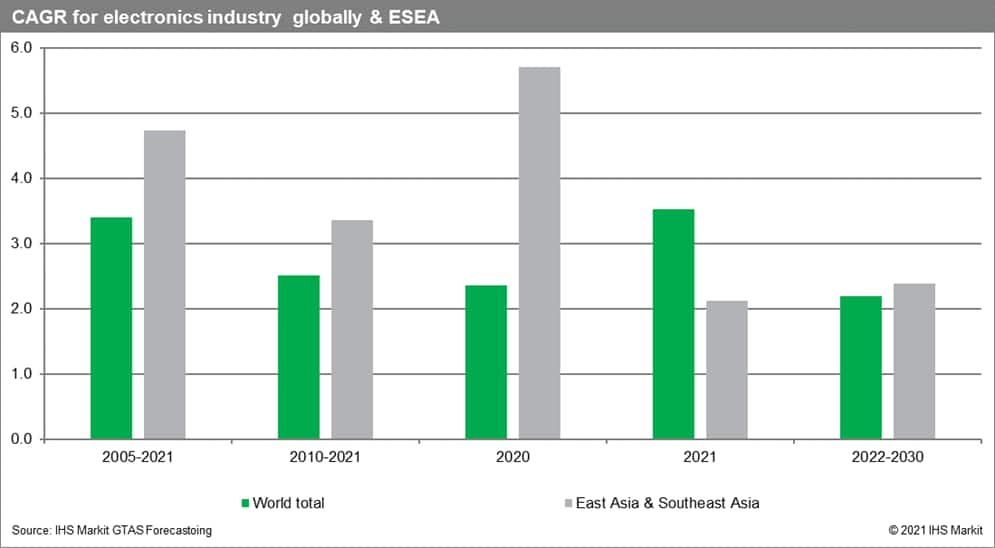
If we look at the electronics industry's global exports from a dynamic perspective, it is clear that east and Southeast Asia are growing faster than the rest of the world. The difference was particularly large in 2020, affected by the COVID-19 pandemic but not in 2021. we predict that CAGRS for global exports and the region exports will be similar over 2022 to 2030, in favor of the region. Considering the current production possibilities, the predicted growth rates are lower than in the period preceding the COVID-19 pandemic.
Export specialization in electronic products in ESEA-11
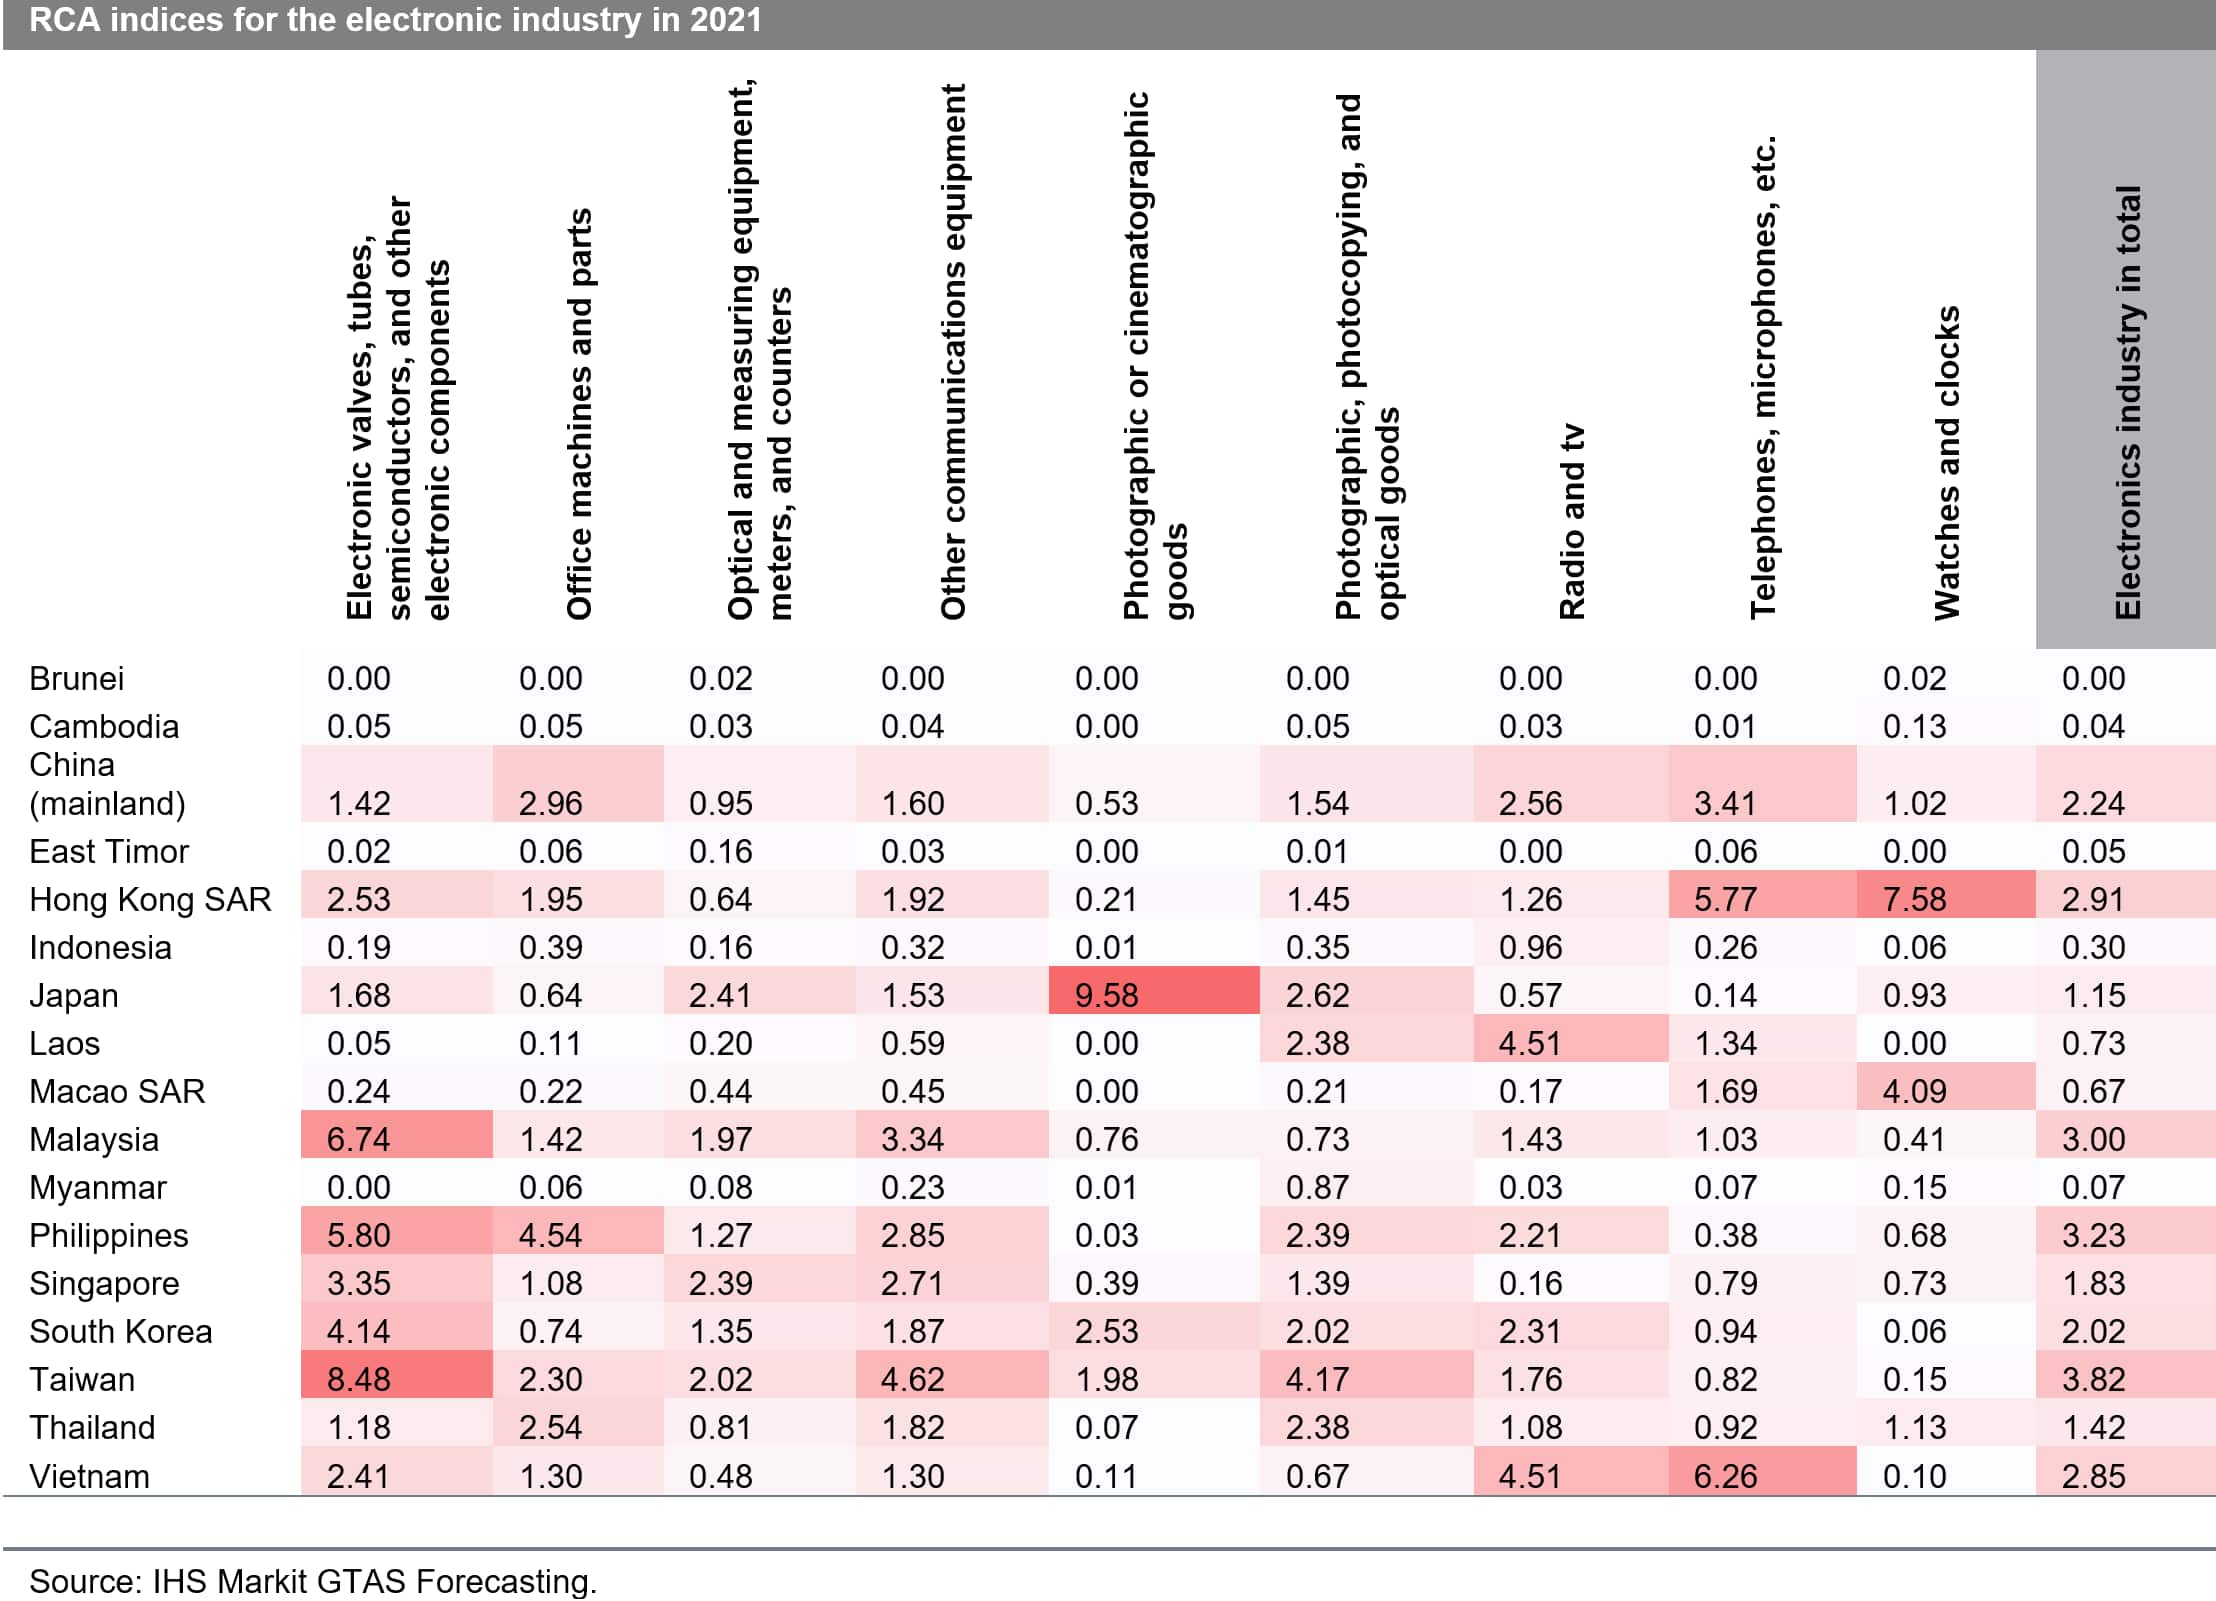
Using the data from the GTAS Forecasting database, we calculated the indices of relative comparative advantage or RCA indices for all significant subcomponents of the electronic industry. The value of two, for instance, means that a given country has twice the export share of a given commodity relative to the world average, which is indicative of specialization. The highest RCA values for electronic components are in Taiwan (8.4), followed by Malaysia (6.7) and the Philippines (5.8). They are higher than can be observed in the region's largest economies, including China (1.4), Japan (1.6), and South Korea (4.1). Mainland China has the highest relative export specialization indices values for telephones and microphones, followed by office machines and parts and radios and TV's.
The region seems to be specialized in every specific element of the electronics industry. It is relatively easy to identify the potential supplier of electronic components within the area or to identify potential assembly plants within the region.
Concluding remarks
The global value chain in electronic products has been disrupted for more than a year, with the crisis centered on semiconductors. It is a side effect of the COVID-19 pandemic, with increased demand for personal computers, tablets, and smartphones, at the height of the pandemic and the subsequent recovery from it in which direct and indirect demand for electronic products and components met with limited production possibilities adversely affected by Covid-related closures at wafer fabs and international shipping ports, port congestion and increased costs of freight.
The forecasted lower growth rates in global demand in 2022 can, to some extent, ease off the pressures on this crucial industry in the short run. Nonetheless, in the long run, the production of electronic components must increase, taking into account the higher dependency of the global economy on this high-tech sector. It applies to the semiconductor industry in particular. The worldwide semiconductor shortage will persist through 2021 and is expected in the report by Gartner to recover to normal levels only by the second quarter of 2022. It will adversely affect production in many chip-dependent GVC, not only in electronics, and affect the production volumes of specialized products while simultaneously impacting prices.
The solution to the problem has to partially come out from the East and Southeast Asia region itself. But not only. The global economy needs more production facilities that are extremely expensive and complex and, despite high levels of automation, require highly skilled workers.
Still, in general, some more profound adjustments in GVCs can also be expected, affecting location choices, investment in increased production capacities, and significant trade flows. Investors from North America or Europe could, for instance, increasingly prefer locations in closer proximity to final assembly plants, so more nearshoring could be expected. In the long run, access to key resources such as roll earth minerals will be of key significance. The problem can only be partially resolved by enhancing electronic ways policies and recycling.
The qualitative factors to be considered include:
Subscribe to our monthly newsletter(opens in a new tab) and stay up-to-date with our latest analytics
How can our products help you?
