Featured Topics
Featured Products
Events
S&P Global Offerings
Featured Topics
Featured Products
Events
S&P Global Offerings
Featured Topics
Featured Products
Events
S&P Global Offerings
Featured Topics
Featured Products
Events
Financial and Market intelligence
Fundamental & Alternative Datasets
Government & Defense
Banking & Capital Markets
Economy & Finance
Energy Transition & Sustainability
Technology & Innovation
Podcasts & Newsletters
Financial and Market intelligence
Fundamental & Alternative Datasets
Government & Defense
Banking & Capital Markets
Economy & Finance
Energy Transition & Sustainability
Technology & Innovation
Podcasts & Newsletters
BLOG — Apr 17, 2024
By Gordon Greer and Michael Zdinak
Learn more about our Global Economic Forecasting and Analysis
The 2024 tax filing season officially kicked off on Jan. 29, when the US Internal Revenue Service (IRS) began processing federal tax returns for the year 2023. In their announcement, the IRS said it expects more than 128 million individual returns to be filed by the April 15 deadline, down 6% from 2023.
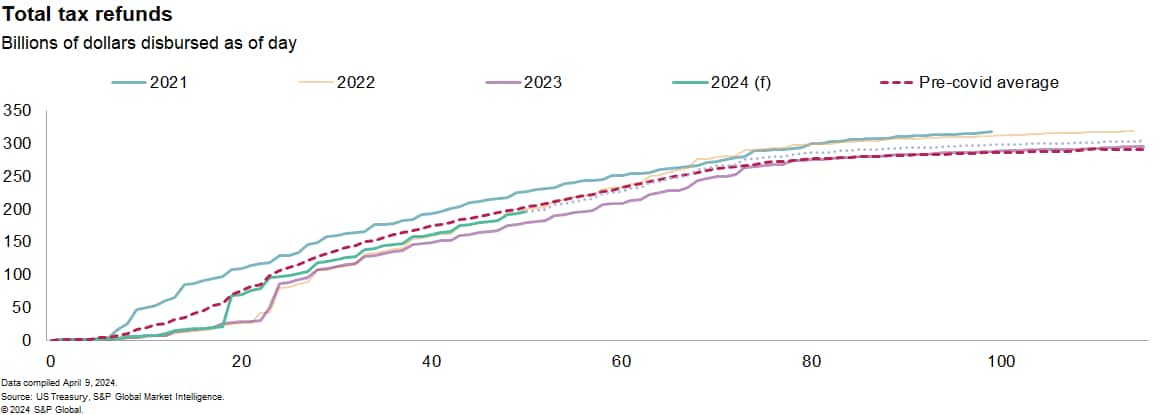
Even with the later start and conservative guidance, individual refunds this tax season are likely to surpass last year's windfall. We estimate more than $303 billion in refunds will be issued between Jan. 29 and June 30 this year, up 2.8% from 2023.
That's good news for retailers betting tax refunds will help boost demand. Recently, retail sales had been slowing, and February's bounce back looked half-hearted given the momentum in spending late last year. March, however, gave us a clearer picture of a consumer holding steady in the first quarter. In our forecast, tax refunds are expected to help stabilize sales and raise demand heading into the second quarter.
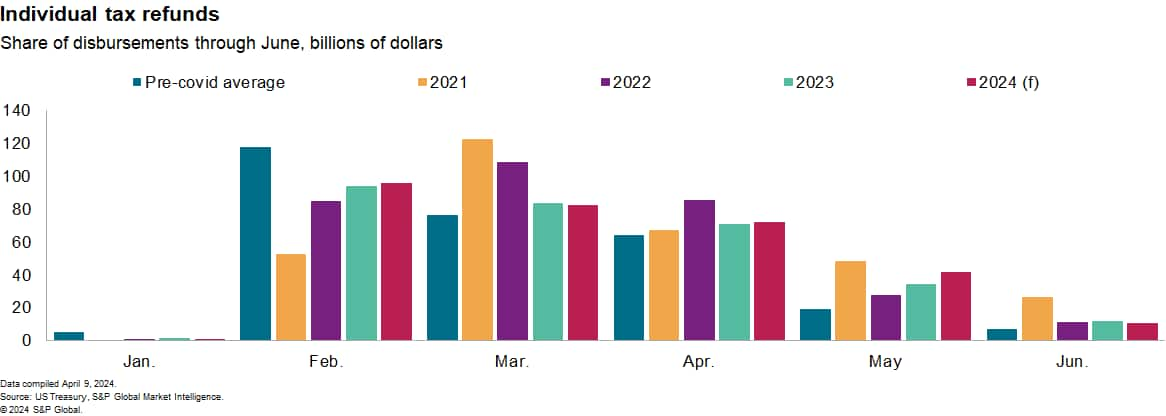
Refunds in 2024 are off to a strong start. We estimate that $191.7 billion has been refunded from Jan. 29 through April 5, up 7.2% from the amount disbursed in the first 50 days of 2023. Still, that's below the pace of 2022. Broken down by month, we estimate February 2024 saw $2.2 billion more in refunds, compared with the previous year, while March 2024 saw about $1.3 billion less. The strong pace of tax refunds in the first two months suggests that the IRS is managing a quicker pace of review compared with recent years.

Before the pandemic, the bulk of tax refunds had been distributed in February. In recent years, however, antifraud regulations have pushed refunds into early March, shifting consumer spending patterns. Notably, the 2015 Protecting Americans from Tax Hikes (PATH) Act requires the IRS to hold refunds claiming either of two deductions, the Earned Income Tax Credit (EITC) and the Child Tax Credit (CTC), until mid-February, delaying the issuance of a significant portion of tax refunds.
This year, the IRS announced EITC and CTC related refunds would be available by Feb. 27. In our tracking, this estimate proved to be conservative, with a sharp rise in refunds occurring on Feb. 22. That this surge in refunds comes a full week earlier than in the previous two years is due in part to the changes stemming from the 2017 Tax Cuts and Jobs Act (TCJA) and the 2022 Inflation Reduction Act (IRA) which aimed to simplify filings and expedite processing by expanding the standardized deduction and allocating additional funding to the IRS to improve services to taxpayers.

Although the total amount of tax refunds is unlikely to be affected by either law, consumer spending patterns will be, in part because the individuals receiving these funds are more likely to spend them quickly. This year, the concentration of refunds flowing to consumers, including $52 billion in a single week, probably provided a boost to spending in early March, which previously might have occurred in late February.
For this reason, the timing of refunds matters to retailers. Historically, we find a 10% increase in refunds, year-over-year, to be associated with a roughly 2% rise in retail spending at general merchandise, apparel, furniture, and other merchandise stores. Given the late start and delayed release for held funds, the result suggests between $4 billion and $6 billion of total retail spending was moved from February into March this year by these changes.
Total retail trade and food service sales rose a robust 0.7% in March, with growth driven by strong sales at nonstore retailers and general merchandise stores. While sales last month were 4.0% higher than a year ago, the sharp drop in January means sales in the first quarter grew just 0.2%, seasonally adjusted at an annual rate. This represents a slowing compared to the prior two years, when nominal sales were boosted first by the recovery from the pandemic and then by a sharp rise in inflation. This year, an anemic housing market, softening demand, and slowing inflation are all weighing on current dollar sales. In our view, the large amount of tax refunds disbursed helped turn growth of retail sales positive in the first quarter and will help steady demand heading into the second quarter.
Discover our Regional Explorer for economic data
This article was published by S&P Global Market Intelligence and not by S&P Global Ratings, which is a separately managed division of S&P Global.