Customer Logins
Obtain the data you need to make the most informed decisions by accessing our extensive portfolio of information, analytics, and expertise. Sign in to the product or service center of your choice.
Customer Logins
EQUITIES COMMENTARY
Jun 15, 2018
Social media indicator review
In March 2014, we introduced a set of social media indicators, in partnership with Social Market Analytics, Inc., that classify the text content in daily Twitter posts to construct a family of social media signals. With four years of live data since the initial roll out and over 6 years of out of sample history since SMA's inception, we revisit this developing discipline for gauging investor sentiment at a time when President Trump's predilection for tweeting consumes the news media, with some suggesting the social media service was the the big winner of the 2016 US election, and has now joined the S&P 500.
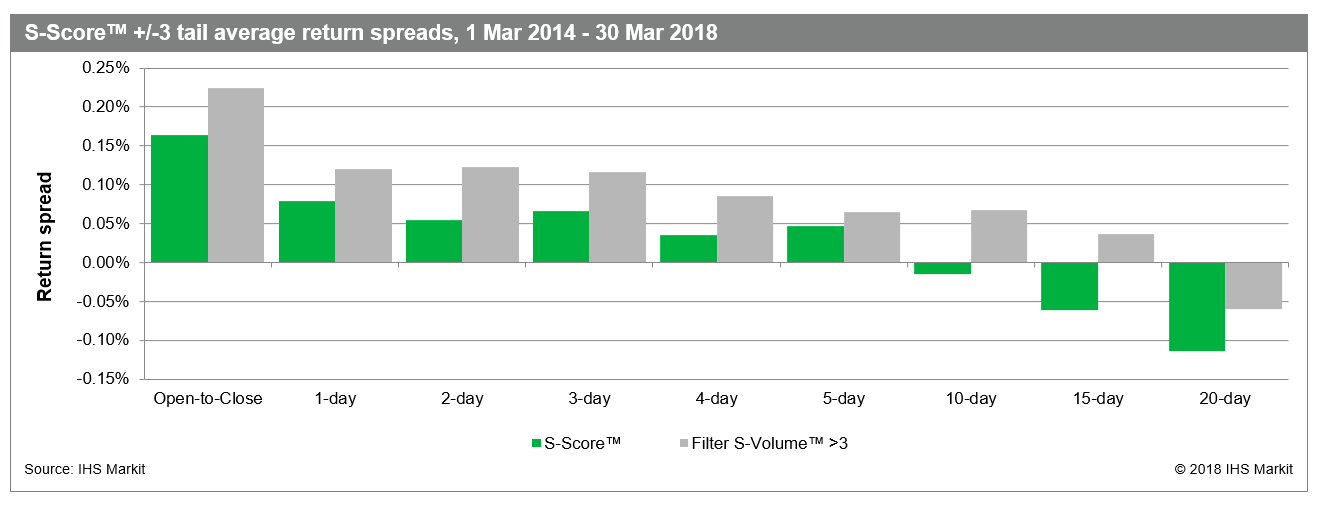
For names at the extreme tails (3 standard deviations) of the factor distribution, we report notable S-Score™ average daily return spreads of 0.163% since the factor went live, with robustness to longer 10-day holding periods and to long-only strategies
When focusing on frequently tweeted names, average daily return spreads improve to 0.215% and more than double the stand-alone result at the 10-day time horizon
- Social media sentiment differentiates outperformers from underperformers across high momentum and low momentum buckets, and across high short interest and low short interest buckets, validating the sentiment is not fully captured by common factors

S&P Global provides industry-leading data, software and technology platforms and managed services to tackle some of the most difficult challenges in financial markets. We help our customers better understand complicated markets, reduce risk, operate more efficiently and comply with financial regulation.
This article was published by S&P Global Market Intelligence and not by S&P Global Ratings, which is a separately managed division of S&P Global.
{"items" : [
{"name":"share","enabled":true,"desc":"<strong>Share</strong>","mobdesc":"Share","options":[ {"name":"facebook","url":"https://www.facebook.com/sharer.php?u=http%3a%2f%2fwww.spglobal.com%2fmarketintelligence%2fen%2fmi%2fresearch-analysis%2fsocial-media-indicator-review.html","enabled":true},{"name":"twitter","url":"https://twitter.com/intent/tweet?url=http%3a%2f%2fwww.spglobal.com%2fmarketintelligence%2fen%2fmi%2fresearch-analysis%2fsocial-media-indicator-review.html&text=Social+media+indicator+review+%7c+S%26P+Global+","enabled":true},{"name":"linkedin","url":"https://www.linkedin.com/sharing/share-offsite/?url=http%3a%2f%2fwww.spglobal.com%2fmarketintelligence%2fen%2fmi%2fresearch-analysis%2fsocial-media-indicator-review.html","enabled":true},{"name":"email","url":"?subject=Social media indicator review | S&P Global &body=http%3a%2f%2fwww.spglobal.com%2fmarketintelligence%2fen%2fmi%2fresearch-analysis%2fsocial-media-indicator-review.html","enabled":true},{"name":"whatsapp","url":"https://api.whatsapp.com/send?text=Social+media+indicator+review+%7c+S%26P+Global+ http%3a%2f%2fwww.spglobal.com%2fmarketintelligence%2fen%2fmi%2fresearch-analysis%2fsocial-media-indicator-review.html","enabled":true}]}, {"name":"rtt","enabled":true,"mobdesc":"Top"}
]}


