Customer Logins
Obtain the data you need to make the most informed decisions by accessing our extensive portfolio of information, analytics, and expertise. Sign in to the product or service center of your choice.
Customer Logins
MUNICIPAL MARKET COMMENTARY
Nov 13, 2018
Municipal bonds show some insulation from rising rates
The investment grade segment of the tax exempt US municipal bond market differentiates itself from other US fixed-rate bond markets by typically trading to a spread to a AAA municipal bond yield curve that is created by amalgamating market color from the primary and secondary markets' trading activity in lieu of benchmarking against a government bond yield. There is still significant correlation between the AAA municipal bond yield curve and the US Treasury (UST) yield curve, but municipal bonds yields are often (albeit not always) lower than their equivalent maturity government bond given their tax benefit.
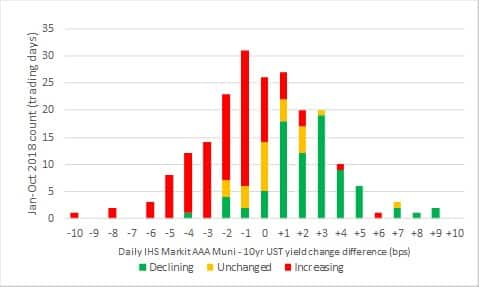
Data indicates that daily changes in municipal bond yields matched up exactly with changes to their equivalent maturity Treasury bond yield on 12% of the trading in 2018 (through October). Figure 1 shows the frequency of the daily spread difference between the 10yr AAA municipal bond yields curve from IHS Markit versus the 10yr UST, with the color of the bar indicating the direction of 10yr UST yields on a given day. For example, on Oct 17 10yr AAA municipal bond yield curve from IHS Markit decreased by 1bp and 10yr UST yields increased by 3bps, which resulted in a -4bp (-1bp-3bps) differential in favor of municipal bonds. The chart indicates that 10yr AAA municipal bond yields typically rose less than 10yr UST yields on days when Treasuries sold off, but municipal bond yields did decline less than UST on days when rates rallied. These dynamics are partially explained by the fact that IG municipal bonds typically trade based on their yield ratio to an equivalent maturity UST (ratio is usually less than 100%), so maintaining the same ratio in a rising rate environment would require municipal bond yields to decline less and vice versa for a declining rate environment.
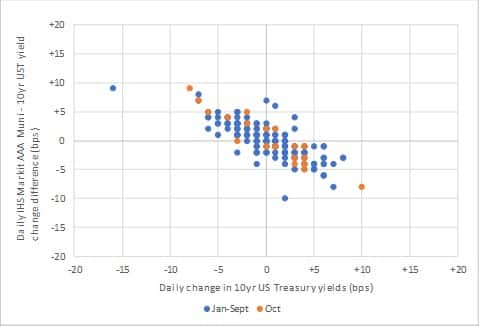
Over the course of 2018 through October, data indicated that there were only seven out of the 210 trading days where 10yr AAA municipal bond yields declined more on days when UST yields also declined (Figure 2). The data also shows that were only 10 days when 10yr AAA municipal bond yields increased more on days when UST yields also increased. October was a particularly unique month, as there were two days near the extremes of daily Treasury rates movements during the year, with 10yr UST yields decreasing 10bps versus AAA municipal bond yields only increasing 2bps on October 3 and 10yr UST yields declining 8bps versus AAA municipal bond yields increasing 1bp on October 11.
In reality, there are few (if any) ways to actually take advantage of the daily differences in AAA municipal bond yield and price movements in a rising rate environment versus UST (or bonds benchmarked to it) given the low supply of AAA municipal bonds and the limited liquidity of the sector versus UST and corporate bonds. It is worth noting that municipal bonds rated below AAA still have a credit spread component that has its own dynamics in different rate environments which needs to be considered. In addition, the low yields of tax exempt municipal bonds make investing in the bonds impractical if the holder can't receive the tax savings like in the case of a non-US investor.
<span/>Figure 1: January - October 2018 frequency of IHS Markit AAA municipal bond - 10yr UST daily yield differentials grouped by direction of 10yr UST yield change

<span/>Figure2 : Comparison between the daily change in 10yr US Treasury (UST) bond yields to the 10yr AAA municipal bond yields from IHS Markit

S&P Global provides industry-leading data, software and technology platforms and managed services to tackle some of the most difficult challenges in financial markets. We help our customers better understand complicated markets, reduce risk, operate more efficiently and comply with financial regulation.
This article was published by S&P Global Market Intelligence and not by S&P Global Ratings, which is a separately managed division of S&P Global.
{"items" : [
{"name":"share","enabled":true,"desc":"<strong>Share</strong>","mobdesc":"Share","options":[ {"name":"facebook","url":"https://www.facebook.com/sharer.php?u=http%3a%2f%2fwww.spglobal.com%2fmarketintelligence%2fen%2fmi%2fresearch-analysis%2fmunicipal-bonds-show-some-insulation-from-rising-rates.html","enabled":true},{"name":"twitter","url":"https://twitter.com/intent/tweet?url=http%3a%2f%2fwww.spglobal.com%2fmarketintelligence%2fen%2fmi%2fresearch-analysis%2fmunicipal-bonds-show-some-insulation-from-rising-rates.html&text=Municipal+bonds+show+some+insulation+from+rising+rates+%7c+S%26P+Global+","enabled":true},{"name":"linkedin","url":"https://www.linkedin.com/sharing/share-offsite/?url=http%3a%2f%2fwww.spglobal.com%2fmarketintelligence%2fen%2fmi%2fresearch-analysis%2fmunicipal-bonds-show-some-insulation-from-rising-rates.html","enabled":true},{"name":"email","url":"?subject=Municipal bonds show some insulation from rising rates | S&P Global &body=http%3a%2f%2fwww.spglobal.com%2fmarketintelligence%2fen%2fmi%2fresearch-analysis%2fmunicipal-bonds-show-some-insulation-from-rising-rates.html","enabled":true},{"name":"whatsapp","url":"https://api.whatsapp.com/send?text=Municipal+bonds+show+some+insulation+from+rising+rates+%7c+S%26P+Global+ http%3a%2f%2fwww.spglobal.com%2fmarketintelligence%2fen%2fmi%2fresearch-analysis%2fmunicipal-bonds-show-some-insulation-from-rising-rates.html","enabled":true}]}, {"name":"rtt","enabled":true,"mobdesc":"Top"}
]}


