Maritime trade and its risks: EU's imports from Asia and the Middle East
Key points:
- Import tonnage increase of 5% over past five years. EU importing from an average of 211 unique Non-EU Trade partners each year - represents 22% increase in value of goods representing 227 Billion dollars in goods.
- COVID-19 has disrupted many supply chains around the world, Q1 shows a reduction in trade activity from ExTra EU as lockdown measures began to be enforced worldwide, countries such as China, India, and Turkey for instance all experienced a reduction of more than 15% in trade compared to last year. In some instances, countries with Indonesia suffered a 44% decrease.
- Anticipated 15% decrease in trade compared to 2019 with East Asia, with some recuperation in 2021 where year-on-year growth is anticipated to be 12%.
- Events are down by 37% year to date compared to last year, with Q2 having the lowest recorded number in the last five years. Bulk/General cargo ships involvement in piracy up by 52% compared to 2019, with crude oil tanker involvement up by 100%.
- It appears that there is a trend between the events data and imports by value with both steadily decreasing through Q4 of 2019 to Q1 of 2020, and starting to increase again in Q2 of this year [for Middle East / Asia specifically]
International Trade
It's unsurprising that an increase in demand over the years has caused a subsequence rise in the number of imports from external European countries. With globalisation taking root in the heart of many economies today, it opens the possibilities of internationally trading goods from far and wide spreading potential risks, while providing a superior range of available produce at different price points.
Shipping remains the most cost-effective means of transporting goods from supplier to buyer, with 75% of goods coming into Europe by sea from external partners.
Looking at past trends over the last five years, the EUs import tonnage increased by 5%, typically importing from an average of 211 unique Non-EU Trade partners each year - now 5% at first glance might not seem like a lot, but it represents a rather substantial increase of 22% in terms of the value of those goods, which is to say a breath taking increase of 227 Billion dollars in goods.

Figure 1: EU imports from Middle East/South Asia Vs Rest of World. Source: IHS Markit - Global Trade Atlas
Just under 30% of the 211 trade partners lie to the East, spread across Northern Africa, Middle East and Asia, of which several fall under the EU/UN sanctions list, subjecting them to different regulations when it comes to trade. The commodity portfolio is predominantly made up of mineral fuels, oils & derivatives, which is unsurprising considering that around 60% of total imports usually constitutes of these types of goods. What is however notable is that of those 60%, 24% or 183 Million Tons comes from this area alone (particularly Saudi Arabia, Iraq, Qatar). Other types of goods to be imported from this region alone include high valued goods such as vehicles, ores, construction materials, electrical goods & Apparels.
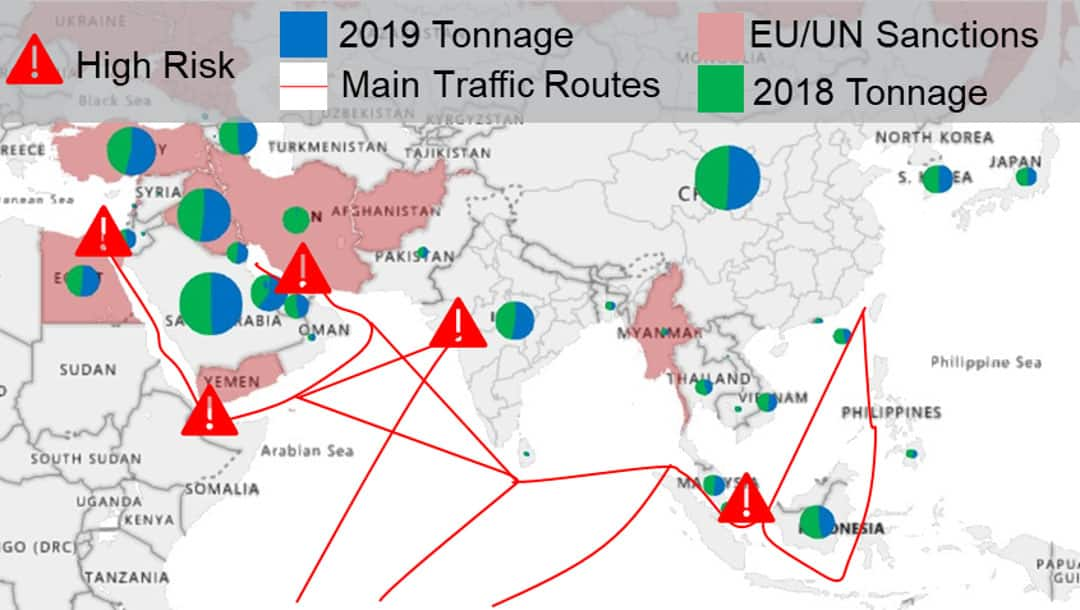
It's no surprise that these incredible dense shipping routes carrying high value cargo are also subject to high exposure, and that these risks are far more present at critical 'checkpoints' within vessel voyages, as highlighted in Figure 2, with particular high risks surrounding the Bay of Malay - a key transition point for commodities sailing from East Asia to Europe by vessel where piracy is notable.

Figure 2: EU imports from Middle East/Asia. 2019/2020 Tonnage year to date Comparison. Source: IHS Markit - Global Trade Atlas
With COVID-19 disrupting many supply chains around the world, We can see in figure 2 how Q1 shows a reduction in trade activity from ExTra EU as lockdown measures began to be enforced worldwide, countries such as China, India, and Turkey for instance all experienced a reduction of more than 15% in trade compared to last year. In some instances, countries with Indonesia suffering a 44% decrease.

Figure 3: EUs imports from top ten Middle East/Asia partners for Q1 2020. Source: IHS Markit - Global Trade Atlas
As we exit Q2 of 2020, lockdowns appear to be easing up in many places around the world, and with production gradually starting up again in many of EUs ExTra dependent countries, such as China should lead to an increase in shipping over Q3 & Q4 of this year if the trend falls in line with historical seasonality. Either way, our total output for 2020 will still be lower than 2019. Looking at our trade forecast for East Asia alone, we anticipate 2020 will show a 15% decrease in trade compared to 2019, with some recuperation in 2021 where year-on-year growth is anticipated to be 12%, but it won't be until well into 2022 that trade reaches the same levels that we saw in 2019.

Figure 4: EU import trade forecast from East Asia. Source: IHS Markit - GTA Forecasting
With companies operating under more financially strenuous circumstances, it's very possible that we start to see an increase in shipping efficiency, meaning greater volumes per shipment as to minimise cost by maximising usable space on vessels, leading to higher value cargo out at sea per vessel which in turn leads to higher exposure.
Global Maritime Events
It's unsurprising to find that some of the more active areas of the world when it comes to shipping also happen to be some of the more event prone. Globally speaking, the number of recorded events, as well as their seriousness have been decreasing over the past two years from the highs that were observed over 2017/18. In Fact, Q2 of 2020 so far has the loweest rates of aggregated piracy, security/legal & ship casualties in the last five years, down by 37% compared to 2019 (Figure 5) - a likely result of the COVID-19 lockdowns which caused a slowdown in the shipping industry.

Figure 5: Global piracy, security/legal disputes & ship casualty time series. Source: IHS Markit - Bespoke Maritime
The same locations year-on-year appear to be affected by similar types of events (Figure 6), with:
- Piracy being prominent in key areas around the world. Predominantly off the Gulf of Guinea, in the Gulf of Aden, The Strait of Hormuz, Off the Gulf of Khambhat, surrounding Bangladesh, The Malay Peninsula and near the FPSO storages to the North East of China.
- Ship Casualties tend to occur in areas of considerably high shipping activity, so it's unsurprising to see the North Sea, the Baltic Sea, the Alboran Sea, as well as the Aegean Sea in Europe to have high numbers, as well as surrounding Hong Kong, Yellow Sea, East China sea in Asia, and to the North East of the Americas, as well as a string along the St Lawrence river between Montreal and Quebec in Canada, and off the Eastern Coast of the US.

Figure 6: Global piracy, security/legal disputes & ship causalities event distribution. Source: IHS Markit - Bespoke Maritime
Piracy in the Middle East/Asia
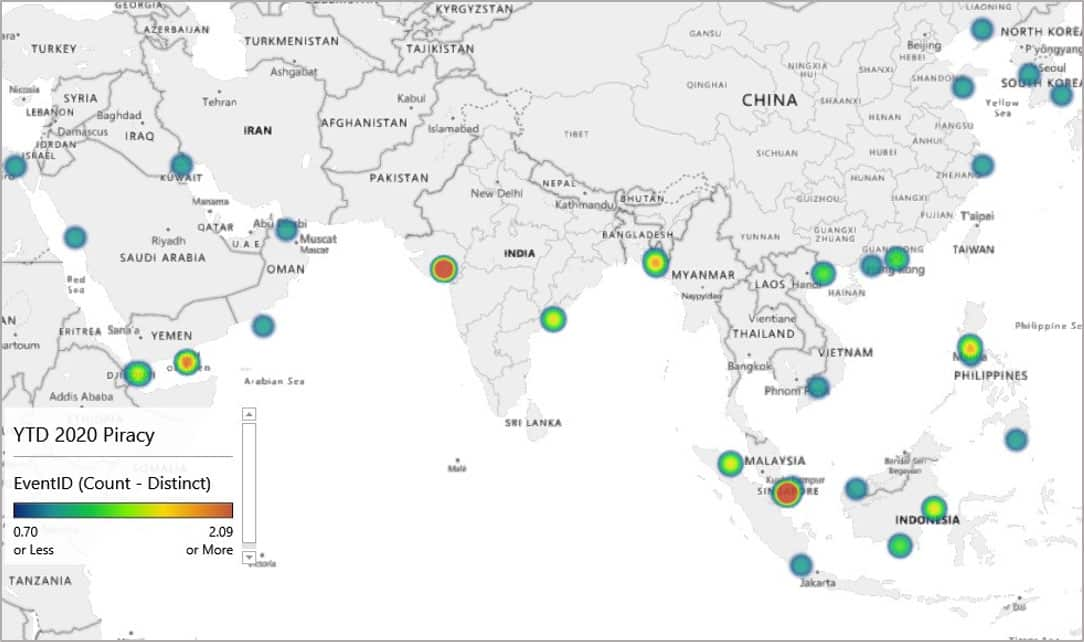
Taking more of a focal lens towards piracy within the Middle East and Asia, we can see more clearly in Figure 7 the areas of relatively high risk within the Middle Eastern and Asia region year to date. Piracy related events within this area appear to be higher year to date than they have been in the past (Figure 8) - with Q1 being the highest observed in the last five years (although this possibly is related to the event reclassification that took place in October 2019). Bulk carriers and general cargo ships involvement in piracy was up by 52% compared to last year, with crude oil tanker involvement up by 100%.
The time of year also appears to influence piracy in specific areas such as India, where we see a decline between May and October when monsoon hits, causing difficulties in terms of launches and potential boarding's (Figure 8).

Figure 7: Year to date piracy distribution around Middle East/Asia. Source: IHS Markit - Bespoke Maritime

Figure 8: Piracy event seasonality in Middle Eastern region & piracy in India. Source: IHS Markit - Bespoke Maritime
In the same way that there is a seasonality in trade, there also appears to be a seasonality in events in this area. Over the last five year average, when looking at piracy, security/legal disputes & ship casualties, the first half of the year sum sits around 169, with the second half showing 187 - so a considerable 11% increase between the two, and same again with piracy, where the average sum for the past five years for the first half is 33, with the count being 48 in the second half representing a 44% increase.
On the trade side, the historical percentage share across the year isn't quite as dramatic, with there only being a 2% difference between the first and second half of the year - however what is interesting is that July onwards is typically when cargo value is at its highest, which also happens to be when piracy appears to start increasing historically (Figure 8 & 9).
Looking at the latest data, it appears as though there is a trend between the events data and imports by value as can be seen on Figure 9 where we can see both steadily decreasing from October 2019 through to March 2020 and starting to increase again starting April 2020. As many economies continue to ease out of lockdown, and trade starting to grow again, it could be that we see an increase in the number of events over this region.

Figure 9: Middle East & Asia imports to EU Vs events in region. Source: IHS Markit - Bespoke Maritime & Global Trade Atlas
Specific Example: British flagged chemical/products tanker STOLT APAL IMO No. 9719240 was involved in a piracy attack in the Gulf of Aden of Al Mukalla, Yemen on the 17th May 2020.
Approached by six armed pirates in two speedboats whilst underway in the Gulf of Aden 115 miles South East of Al Mukalla, at 1530 local time. Armed guard on board fires warning shots causing the pirates to open fire towards the vessel. The armed guard on board returned fire and disabled one speedboat ending the pursuit. Sustained minor damage on the bridge from bullets. No injuries or cargo damage. Authorities informed and the vessel subsequently continued.

Figure 10: Piracy in the Gulf of Aden over the last 36 Months. Source: IHS Markit - Maritime Intelligence Risk Suite
Pirates might be creatures of opportunity, but they're also creatures of habit, because this was the last of a string of piracy related events that have taken place in the Gulf of Aden within the last 36 months, all within 150 nautical miles from one another.
Subscribe to our monthly newsletter and stay up-to-date with our latest analytics
