Featured Topics
Featured Products
Events
S&P Global Offerings
Featured Topics
Featured Products
Events
S&P Global Offerings
Featured Topics
Featured Products
Events
S&P Global Offerings
Featured Topics
Featured Products
Events
Financial and Market intelligence
Fundamental & Alternative Datasets
Government & Defense
Banking & Capital Markets
Economy & Finance
Energy Transition & Sustainability
Technology & Innovation
Podcasts & Newsletters
Financial and Market intelligence
Fundamental & Alternative Datasets
Government & Defense
Banking & Capital Markets
Economy & Finance
Energy Transition & Sustainability
Technology & Innovation
Podcasts & Newsletters
BLOG — Oct 31, 2023
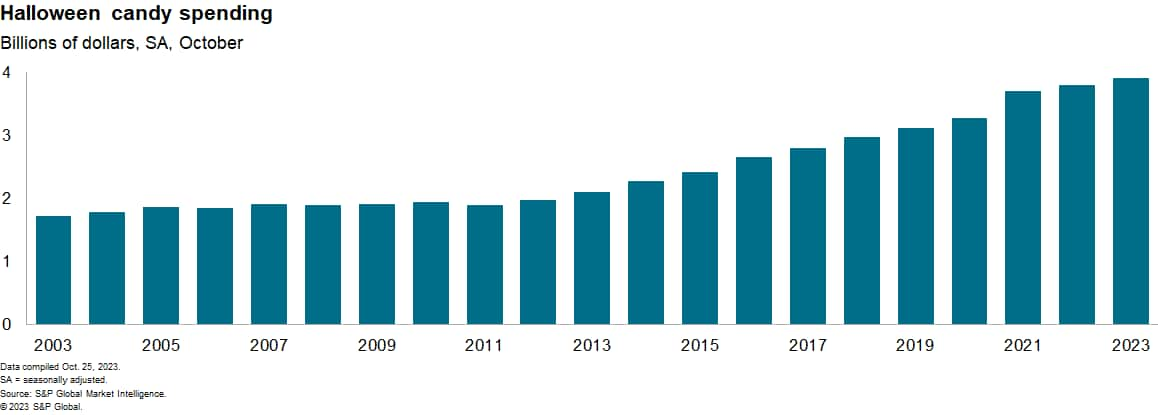
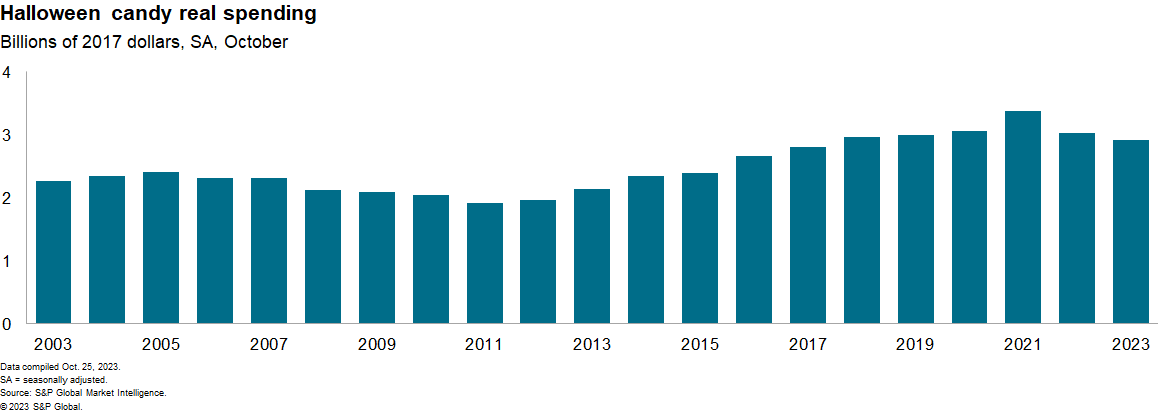
Candy prices are up a frightening 7.2% this year, following a terrifying 14% rise in 2022. In response, real purchases of Halloween candy are expected to fall for a second consecutive year even as current dollar spending reaches a new all-time high.
We crunch the numbers behind this swing in demand to unmask what's scaring away US candy consumers.
Ghastly growth
Before the pandemic, October candy sales grew on average 3.8%, year-over-year, and even the witch's bruhaha that was COVID-19 couldn't dent consumer demand for sweets. Lockdown likely helped lift sales growth to 5.0% in 2020 before sales surged 13.2% in 2021 — just when things were starting to look a bit less paranormal.
Last year, however, BOO-ming candy prices took a king-sized bite out of demand. When faced with getting less candy for more dollars, US consumers brought home less candy. We estimate real spending on Halloween sweets fell from $26.23 per household in 2021 to $23.31 in 2022.
Not to starburst anyone's bubble, but 2023 looks a lot more like 2022 than 2021. In our forecast, growth falls short of the pre-pandemic average for a second year. Why? Because candy prices are surging again, driven higher by surging input and labor costs.

The Producer Price Index (PPI) for the cacao used in chocolate manufacturing is up 15.5% year over year. That follows a 13.8% rise in 2022, driven by unseasonably bad weather in the regions where cacao is grown. Likewise, the PPI for sugar is up 9.6% from this time last year, driven again by the rising cost of importing raw sugar.

Labor costs are rising for candy makers. Average hourly earnings for sugar and confectionery product manufacturing employees are up 13.5% from a year ago, having more than recovered from a 7.9% decline in 2022 when rattled supply chains disrupted manufacturing.
The good and plenty news is, unlike last year, inflation broadly has cooled in 2023 and real incomes are rising. Headline CPI prices are up 3.7%, down from 8.2% one year ago, while average hourly earnings for all workers are 4.2% higher this year.
Our forecast
We look for real disposable income (DPI) to rise more than 4% in 2023, after falling 6% last year, meaning many consumers are in a better place to treat themselves. The National Retail Federation expects a record number of people to engage in the festivities this year. While retailers can still expect crowds, those crowds may be filling their pillowcases with a bit less candy this year.
We expect current dollar spending on Halloween candy to grow 2.9% in 2023, to a record $3.9 billion — almost double what consumers spent on candy a decade ago and the highest year on record. This comes out to about $29.91 per household. Growth is likely to fall short of its pre-pandemic average for the second year in a row, as candy inflation takes another bite out of consumer demand.
Real purchases of Halloween candy (i.e., volumes), are expected to fall for a second consecutive year, by 3.7%, even as current dollar spending reaches a new all-time high. We see real spending on Halloween candy falling to just $22.26 per household, about what people spent on candy in 2017.
The short and sweet of it? There's no sugarcoating the fact that wages haven't kept up with the jaw-breaking rise in candy prices, an hour of work in 2023 earns the average person a whole candy bar less than it did in 2021.
Learn more about our economic data and insights
This article was published by S&P Global Market Intelligence and not by S&P Global Ratings, which is a separately managed division of S&P Global.
