Global production growth slows to 1½-year low at start of 2022 as Omicron hits
A slowing in the worldwide factory sector was signalled in January as the JPMorgan Global Manufacturing PMI fell from 54.3 in December to 53.2, its lowest since October 2020. The index was pulled lower by all five of its components, therefore indicating slower output, new orders, employment and inventory building growth during the month, as well as suppliers being less busy. We explore the details behind the headline PMI in more detail below in ten key charts, looking into the driving forces behind the changes, as well as the inflation implications.
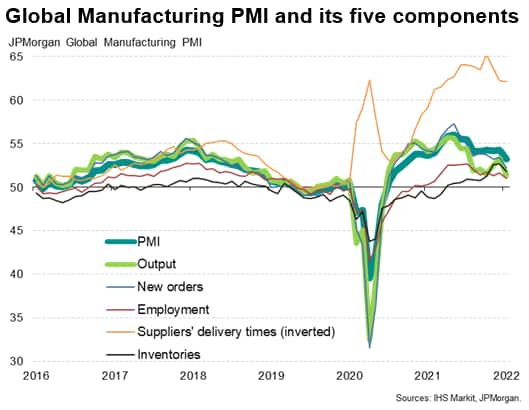
Chart 1: Global output hit by Omicron
The survey's output index fell to a greater extent than the headline PMI, reflecting a marked slowing in production growth to the lowest since the recovery began in July 2020. Rising COVID-19 infection numbers, linked to the Omicron variant, were widely reported as having disrupted factory activity. The slowdown was led by a renewed fall in China and a near-stalling of production in the US. In contrast, production growth accelerated in the eurozone, the UK and Japan. Production in the rest of Asia meanwhile slowed to the weakest since September, though continued to rise at solid rate.
Similarly, new orders growth slowed to the weakest since July 2020, albeit moderating to a lesser extent than output. This divergence suggests that production once again lagged demand (having broadly come into line in December), though to a considerably lesser degree than seen throughout much of 2021.
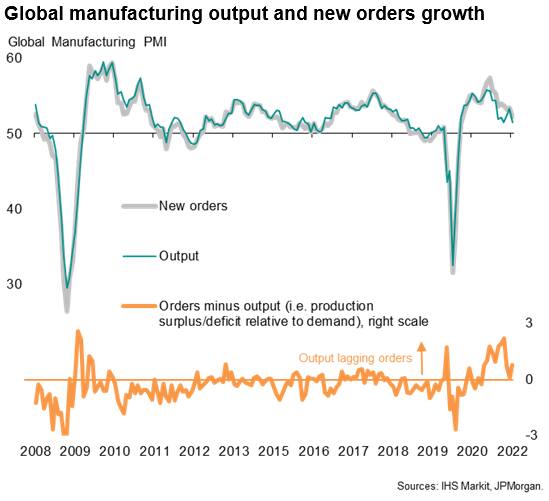
Chart 2: Global exports fall into decline for first time in 17 months
Leading the cooling of demand in January was a drop in global goods export orders for the first time since August 2020. The decline was led by a steepening export loss from mainland China and a slight dip from the US.
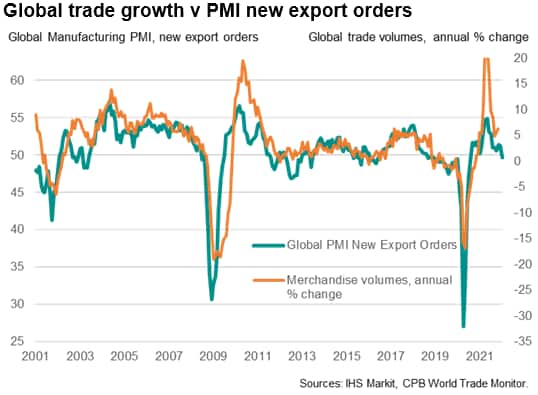
Chart 3: Supply chain delays ease
Better news meanwhile came from the materials supply side. Average supplier delivery times lengthened once again in January, notably in the US, but the incidence of delays worldwide was the lowest recorded since last March. The PMI's delivery times index therefore hints that the global supply crunch was at its worst back in October, and has since eased, even in the face of the Omicron wave.
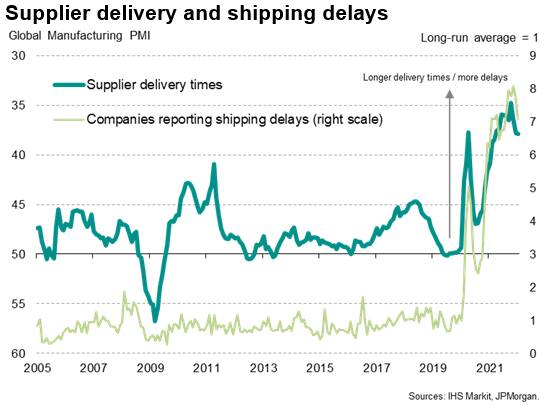
Of particular note, the number of manufacturers reporting that delivery times had lengthened due to shipping-related delays - such as port congestion and a lack of containers (rather than suppliers being out of stock) - fell to the lowest since July of last year.
Chart 4: Output less constrained by component shortages
A consequence of the easing in the number of supplier delays was a reduction in the degree to which output is being constrained by shortages of components, which fell for a third month running in January, down to the lowest since last September.
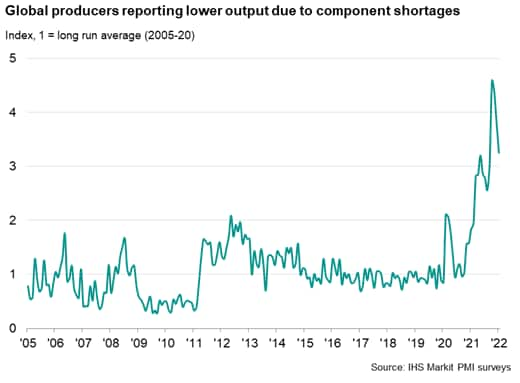
It should be noted, however, that the reporting of output being constrained by materials shortages continued to run at almost three times the long run average, and remains at levels quite unprecedented prior to the pandemic, suggesting that the supply chain squeeze is merely easing rather than disappearing.
Chart 5: Output increasingly constrained by staff shortages
However, there was a visible impact of the Omicron wave on the labour supply. Hence, although supply chain constraints eased, labour constraints worsened. The number of producers worldwide reporting that output had been limited by staff shortages spiked higher in January, rising to over five-times normal levels, as ongoing difficulties hiring staff to fill vacancies were exacerbated by short-term absenteeism due to COVID-19 related illness or self-isolation.
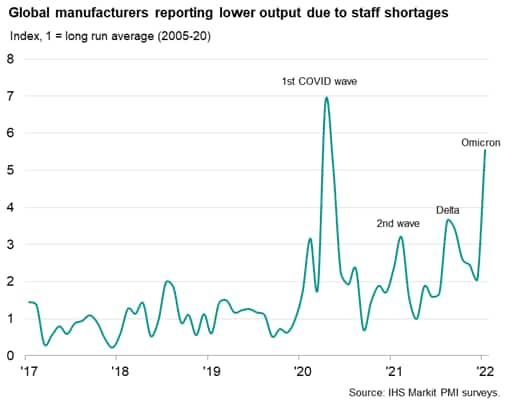
Over 17 years of comparable data, only April 2020 saw a higher degree of output being constrained by staff shortages than seen at the start of 2022.
Labour constraints spiked higher in Europe and Asia, but were especially marked in the US.
Chart 6: Safety stock building appears to have peaked
Signs of the supply crunch easing also led to a reduction in the number of companies building safety stock of inputs to safeguard against future supply issues. The survey had recorded unprecedented raw material inventory building in November and December 2021, with a record number of companies reporting that stocks had been boosted in order to build safety stocks.
However, although inventory levels are still rising at a near-historically-unprecedented rate, the pace of increase has started to slow alongside a commensurate easing in the number of companies citing the need to build safety stocks.
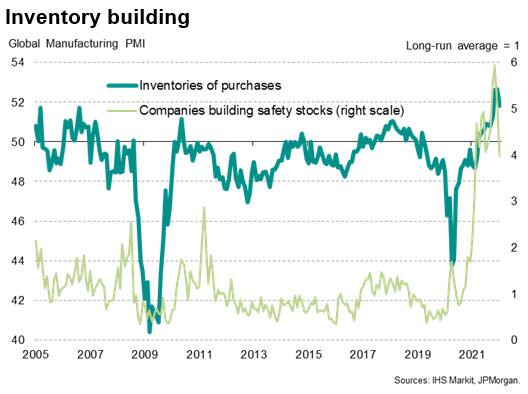
Chart 7: Demand recovery has faded
Alongside the reduced inventory building, Omicron was also cited as having dampened new orders growth. But the survey has been picking up a slowing in demand growth for some time, and the January reduction in new orders growth to the lowest since mid-2020 contributed to a further marked slowing in the build-up of backlogs of work at manufacturers. Despite the disruption to the supply side caused by Omicron in January, notably via the labour market, backlogs of uncompleted orders rose in January at the slowest rate since last February, having peaked at an all-time high back in September.
Importantly, the number of companies reporting that backlogs of work rose in January due to rising demand pressures was the lowest recorded for just over one and a half years.
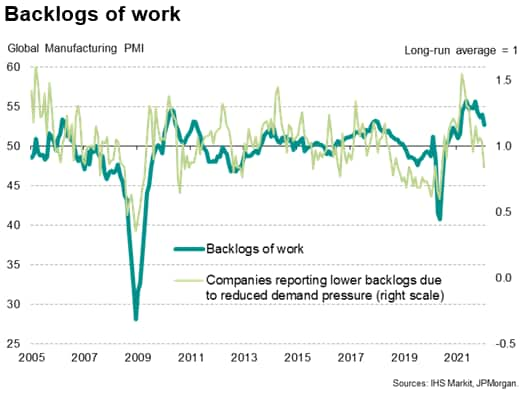
Chart 8: Raw material price pressures have eased (from decade-highs)
With supply chain delays easing and demand pressures waning, January saw a commensurate moderation of raw material input price inflation to the lowest since March of last year. Bear in mind, however, that the rate of inflation remains among the highest seen over the past decade.
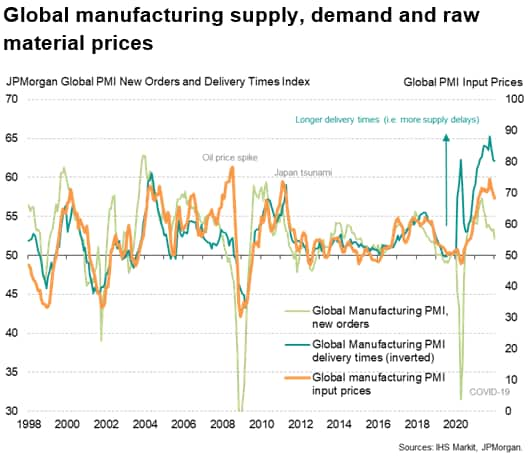
Chart 9: Wage pressures and energy costs are rising
A concern is that, just as the shipping and supply crunch may be showing signs of easing, with Omicron variant also seemingly impacting global supply chains and manufacturing output volumes to a lesser extent than prior waves, other inflationary factors are building. In particular, January saw rising energy prices driving manufacturing prices higher to an extent not seen since 2008, alongside an unprecedented upward pressure from staff costs.
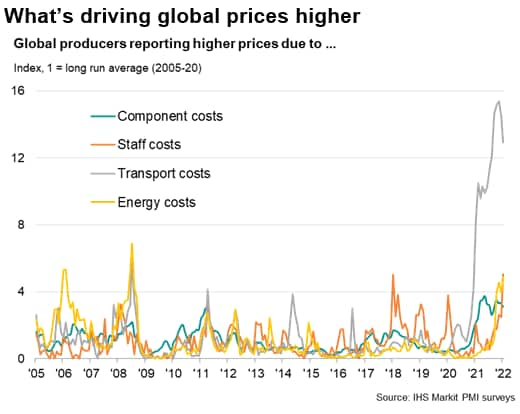
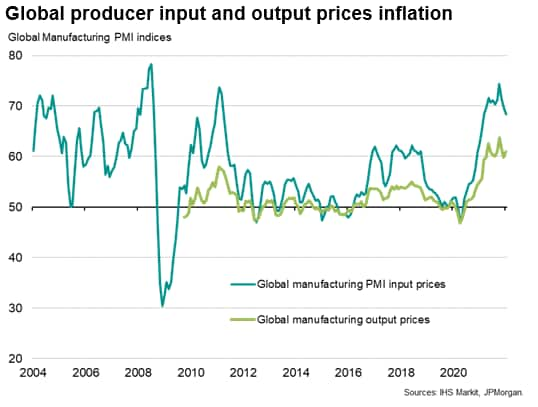
Chart 10: Raw material inflation may be cooling, but selling price inflation is rising
Thus, despite the easing of raw material price inflation, soaring energy costs and rise wage bills pushed the average price charged for goods leaving the factory gate higher in January. Globally, the rate of selling price inflation accelerated to the fourth highest in over a decade of survey history, exceeded only by prior pandemic highs to suggest that upward pressure on consumer prices inflation looks likely to remain historically elevated in coming months.
Chris Williamson, Chief Business Economist, IHS Markit
Tel: +44 207 260 2329
chris.williamson@ihsmarkit.com
© 2022, IHS Markit Inc. All rights reserved. Reproduction in whole
or in part without permission is prohibited.
Purchasing Managers' Index™ (PMI™) data are compiled by IHS Markit for more than 40 economies worldwide. The monthly data are derived from surveys of senior executives at private sector companies, and are available only via subscription. The PMI dataset features a headline number, which indicates the overall health of an economy, and sub-indices, which provide insights into other key economic drivers such as GDP, inflation, exports, capacity utilization, employment and inventories. The PMI data are used by financial and corporate professionals to better understand where economies and markets are headed, and to uncover opportunities.
This article was published by S&P Global Market Intelligence and not by S&P Global Ratings, which is a separately managed division of S&P Global.
