Customer Logins
Obtain the data you need to make the most informed decisions by accessing our extensive portfolio of information, analytics, and expertise. Sign in to the product or service center of your choice.
Customer Logins
ECONOMICS COMMENTARY
Dec 01, 2021
Global manufacturing buoyed by rising Asian output, but supply shortage and price gauges hold close to recent highs
Worldwide manufacturing output growth remained subdued in November as ongoing near-record supply shortages were accompanied by a slowing of demand growth. Existing shortages were exacerbated by an unprecedented surge in safety stock building as producers grew concerned over further supply constraints amid rising COVID-19 worries, leading to yet another steep increase in goods prices.
Although the rate of price increase slowed slightly globally and the rate of supplier lead-time lengthening eased, thanks in part to rising production in Asia and lower prices in China, the outlook has darkened with the advent of the Omicron variant.
We review the latest PMI data with 10 key charts.
Global PMI edges lower
The JPMorgan Global Manufacturing PMI, compiled by IHS Markit from its proprietary business surveys, edged lower from 54.3 in October to 54.2 in November. The barely-changed headline reading, signalling a steady above-trend improvement in manufacturing sector business conditions, masked important signals from the survey's sub-indices, including the five components of the PMI itself. These signals are explored in the following ten charts.
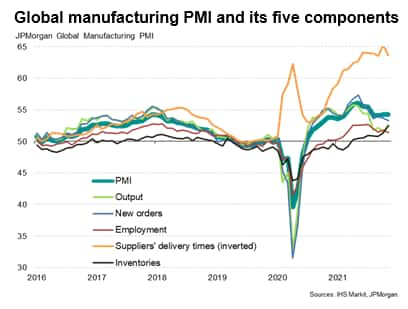
Chart 1: Output growth revives in Asia but remains subdued in the US and Europe
When analysing the survey data, it is important to bear in mind that the headline PMI is a blend of five survey gauges and to get a picture of changing production trends we need to look at the survey's output index data.
Globally, the output index rose to a four-month high in November but, at 52.6, remained far weaker than the headline PMI and merely in line with its long-run average. Although output growth accelerated in both the US and Eurozone in November, the rates of expansion remained amongst the lowest since the middle of 2020 as output was constricted by shortages of raw materials. Relatively modest production growth was also again seen in the UK, likewise reflecting shortages though - unlike the US and eurozone - also linked to falling exports.
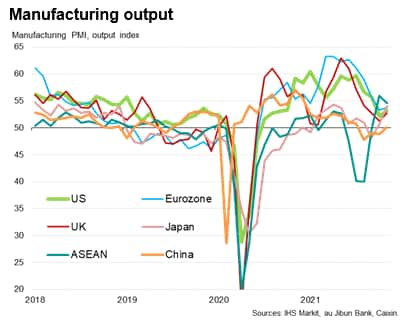
However, perhaps the most encouraging news came from Asia, as many economies saw the Delta wave impact fade. Production in Japan meanwhile accelerated to the fastest since April, and the second fastest since 2018, on the back of rising demand and fuller export order books. Production in China also stabilised after two months of falling output, hinting at some improvement after the reintroduction of covid measures implemented to counter the Delta wave.
Similarly, production continued to rebound strongly from Delta wave related restrictions in the ASEAN region, albeit losing some momentum compared to October yet remaining the second-strongest in almost a decade of comparable survey history. Across Asia as a whole, production growth accelerated to the fastest since May.
Chart 2: Production shortfall reported for ninth month
Growth of new orders waned to a 15-month low in November which, combined with the upturn in output growth, helped narrow the recent shortfall of production relative to demand. Nevertheless, global production growth continues to lag that of demand, a trend that has now been witnessed for nine successive months, with especially marked shortfalls recorded in the US, Eurozone, Taiwan and South Korea in November.
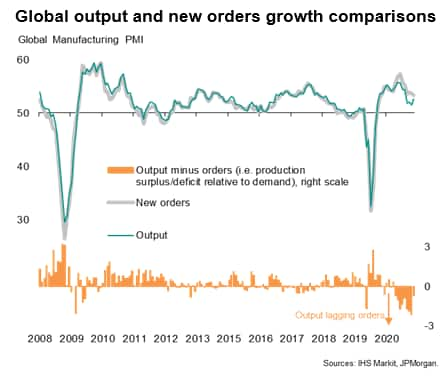
Chart 3: Backlogs of work rise sharply, though at reduced rate
The ongoing shortfall of production relative to demand resulted in a further build-up of uncompleted orders at global manufacturers, which have now risen for 16 consecutive months with especially marked rises seen over the past nine months.
Inventories of finished goods meanwhile fell sharply, reflecting the ongoing need among many manufacturers to meet current demand by eating into warehouse finished stock.
However, the increased in backlogs of work and the depletion of warehouse inventories were both less marked than in October.
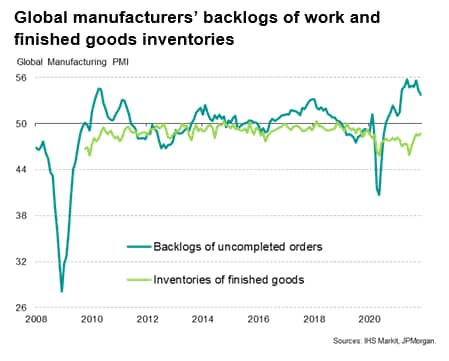
Chart 4: Supplier delays moderate but remain close to all-time highs
In many instances, a shortfall of production relative to demand (and the resulting build-up of backlogs of work) was again blamed on supply chain delays and shortages of inputs. Supplier delivery times continued to lengthen globally at a rate greatly exceeding anything recorded on over two decades of survey history prior to the pandemic, albeit with the incidence of delays moderating slightly in November from October's all-time high.
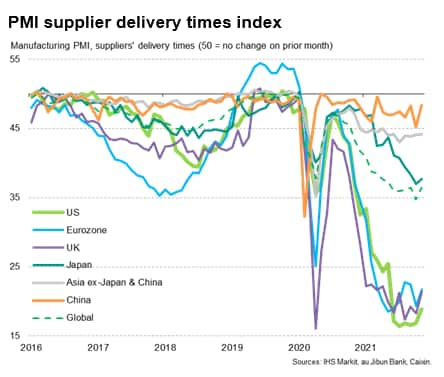
Supply delays were again associated with a number of causes, ranging from suppliers lacking production capacity to shortages of shipping containers, trucker shortages and port congestion.
While every economy covered by IHS Markit's surveys saw longer lead times in November, the incidence of delays recorded by countries located in North America and Europe continued to run far higher than in Asia.
Chart 5: Supply shortages prompt record safety stock building
The ongoing imbalance of supply and demand was exacerbated by a record degree of safety stock building in November, as manufacturers increasingly sought to purchase additional inputs in an attempt to safeguard future production. Worldwide inventories of purchases inputs consequently also rose at a survey record rate.
Steep rises in raw material inventories were seen in Europe and the US as well as Asia, albeit with China only recording a marginal rise. Record inventory increases were in fact seen in the eurozone and Asia ex-China.
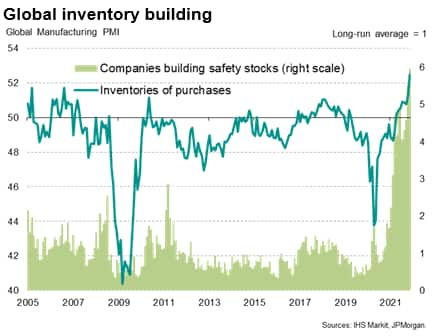
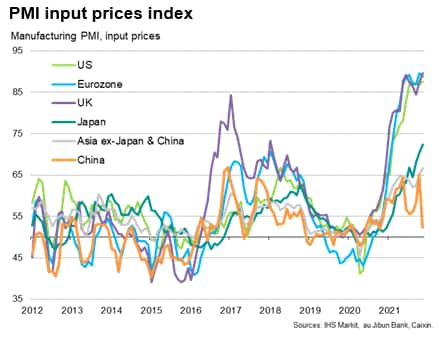
Chart 6: Record input price inflation eases
With global supply chain delays continuing to run at one of the highest levels seen almost a quarter of a century of survey data history, a sellers' market persisted, driving up manufacturers' input costs at one of the sharpest rates seen since the oil price spike of 2008-9.
However, with the incidence of supply chain delays easing slightly during the month, likely attributable in part to the resurgent production growth across large swathes of Asia, and demand growth continuing to cool, the overall rate of input cost inflation slowed in November from October's recent peak.
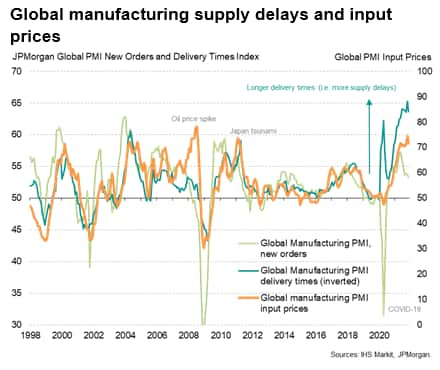
Chart 7: Energy and shipping prices add to producers' woes
While November brought some signs of the imbalance of supply and demand easing, rising shipping costs and higher energy costs added to producers' woes in 2021. The proportion of PMI respondents reporting higher shipping prices rose far above anything ever previously recorded by the surveys, running at over 15 times the long-run average. The proportion reporting higher energy prices meanwhile spiked to the highest since mid-2008, running at just over four times the long run average.
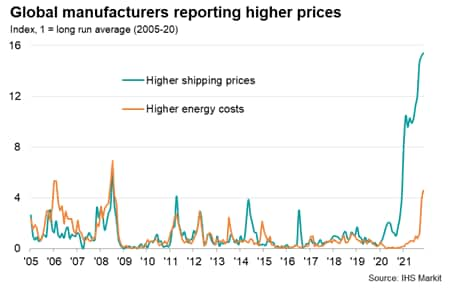
Chart 8: China bucks price trend
All economies reported higher input costs, led by record increases in the US and UK and a near-record increase in the eurozone. Japan saw the steepest rise since 2008 but China saw the rate of cost inflation slow sharply, broadly linked to the impact of lower coal prices. However, the rest of Asia reported the sharpest input cost increase for over a decade.
Chart 9: Steepest factory gate price inflation seen in Europe and the US
Strong regional divergences were also seen for selling price inflation. Average prices charged for goods leaving the factory gate barely rose in China but surged higher in Europe and the US, with more modest but steep rates seen in Japan and the rest of Asia as a while.
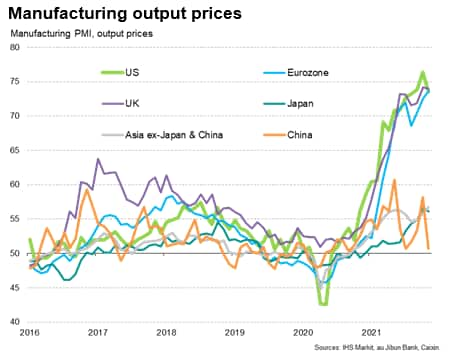
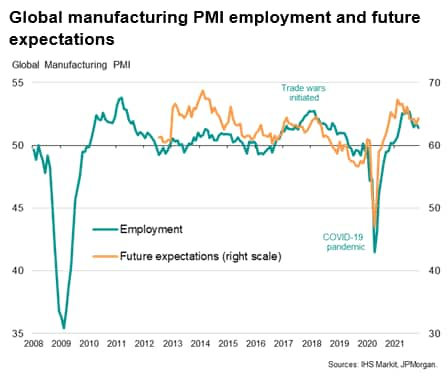
Chart 10: Future expectations lift higher but remain subdued by covid worries
Global factory jobs growth meanwhile slipped to the joint-lowest seen over the past nine months, in part due to poor availability of labour in some countries (notably the US) but also because companies' future expectations remain subdued relative to the highs seen earlier in the year. Although future expectations brightened slightly in November, optimism had slipped in October to the lowest for a year. Prospects continued to be darkened by concerns over supply constraints, rising prices and, more broadly, worries about the pandemic.
With the survey data for November collected prior to the news of the Omicron variant, it is likely that future business expectations will fall further in December.
Chris Williamson, Chief Business Economist, IHS Markit
Tel: +44 207 260 2329
chris.williamson@ihsmarkit.com
© 2021, IHS Markit Inc. All rights reserved. Reproduction in whole
or in part without permission is prohibited.
Purchasing Managers' Index™ (PMI™) data are compiled by IHS Markit for more than 40 economies worldwide. The monthly data are derived from surveys of senior executives at private sector companies, and are available only via subscription. The PMI dataset features a headline number, which indicates the overall health of an economy, and sub-indices, which provide insights into other key economic drivers such as GDP, inflation, exports, capacity utilization, employment and inventories. The PMI data are used by financial and corporate professionals to better understand where economies and markets are headed, and to uncover opportunities.
This article was published by S&P Global Market Intelligence and not by S&P Global Ratings, which is a separately managed division of S&P Global.
{"items" : [
{"name":"share","enabled":true,"desc":"<strong>Share</strong>","mobdesc":"Share","options":[ {"name":"facebook","url":"https://www.facebook.com/sharer.php?u=http%3a%2f%2fwww.spglobal.com%2fmarketintelligence%2fen%2fmi%2fresearch-analysis%2fglobal-manufacturing-buoyed-by-rising-asian-output-Dec21.html","enabled":true},{"name":"twitter","url":"https://twitter.com/intent/tweet?url=http%3a%2f%2fwww.spglobal.com%2fmarketintelligence%2fen%2fmi%2fresearch-analysis%2fglobal-manufacturing-buoyed-by-rising-asian-output-Dec21.html&text=Global+manufacturing+buoyed+by+rising+Asian+output%2c+but+supply+shortage+and+price+gauges+hold+close+to+recent+highs+%7c+S%26P+Global+","enabled":true},{"name":"linkedin","url":"https://www.linkedin.com/sharing/share-offsite/?url=http%3a%2f%2fwww.spglobal.com%2fmarketintelligence%2fen%2fmi%2fresearch-analysis%2fglobal-manufacturing-buoyed-by-rising-asian-output-Dec21.html","enabled":true},{"name":"email","url":"?subject=Global manufacturing buoyed by rising Asian output, but supply shortage and price gauges hold close to recent highs | S&P Global &body=http%3a%2f%2fwww.spglobal.com%2fmarketintelligence%2fen%2fmi%2fresearch-analysis%2fglobal-manufacturing-buoyed-by-rising-asian-output-Dec21.html","enabled":true},{"name":"whatsapp","url":"https://api.whatsapp.com/send?text=Global+manufacturing+buoyed+by+rising+Asian+output%2c+but+supply+shortage+and+price+gauges+hold+close+to+recent+highs+%7c+S%26P+Global+ http%3a%2f%2fwww.spglobal.com%2fmarketintelligence%2fen%2fmi%2fresearch-analysis%2fglobal-manufacturing-buoyed-by-rising-asian-output-Dec21.html","enabled":true}]}, {"name":"rtt","enabled":true,"mobdesc":"Top"}
]}


