Global inflation peak signalled as supply delays ease and demand falters
The latest PMI data compiled for JPMorgan by S&P Global showed companies' input costs rising at the slowest rate for four months, signalling a cooling of global consumer price inflation in the coming months. While input cost inflation has moderated on previous occasions during the pandemic, this time looks different due to a faltering of demand that is not related to COVID-19 containment, a greater-than-previously-seen easing of supply constraints, evidence of less inventory building (and even destocking), as well as a gloomier economic outlook.
The following survey data reflect information provided by panels of over 30,000 companies in 45 countries and tell the story of the current inflation picture in 13 key charts.
Global cost pressures ease from 14-year high
Global cost pressures eased in June, according to S&P Global's PMI business survey data, albeit remaining elevated. The survey gauge tracking changes in costs among both manufacturing and service sector companies worldwide fell from 71.5 in May, its highest since July 2008, to a four-month low of 69.3.
The PMI input cost series acts as a useful advance indicator of consumer price inflation, with changes in firms' costs tending to feed through to CPI with a lag of one or more months (see chart 1).
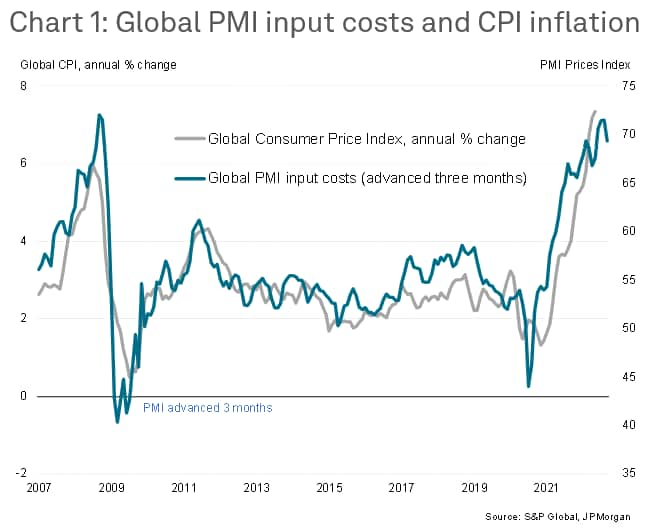
The PMI data therefore point to a potential peaking in the rate of CPI inflation, albeit remaining very high by historical standards despite the fall seen in June, commensurate with annual CPI inflation still running at approximately 7%.
Broad-based moderation of cost growth
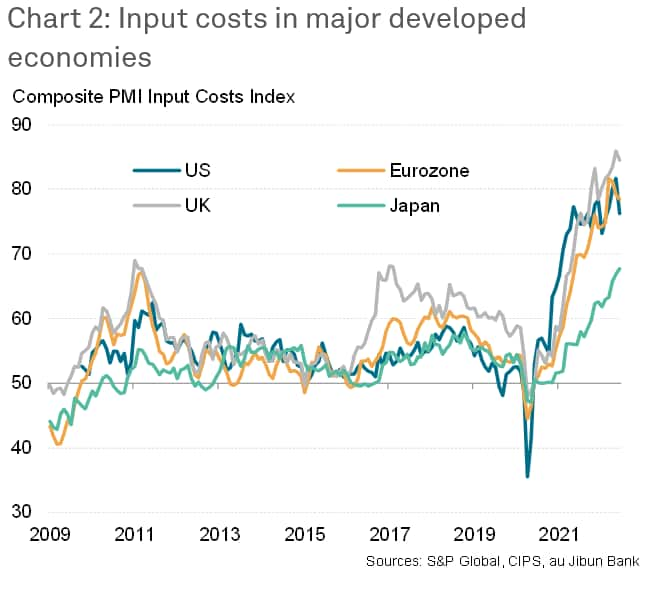
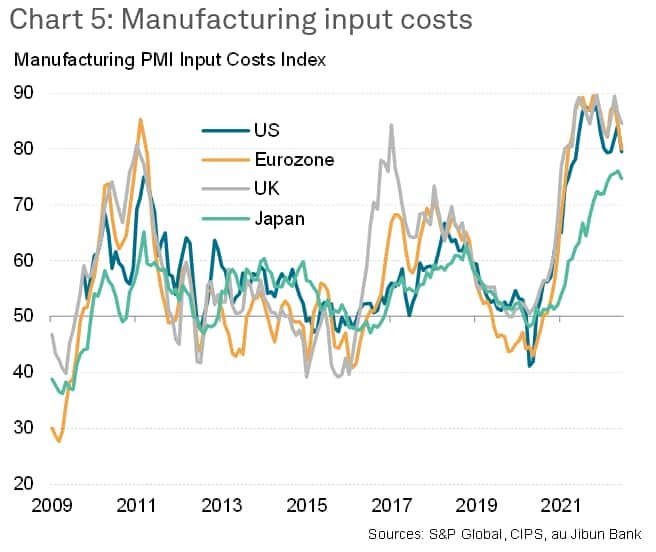
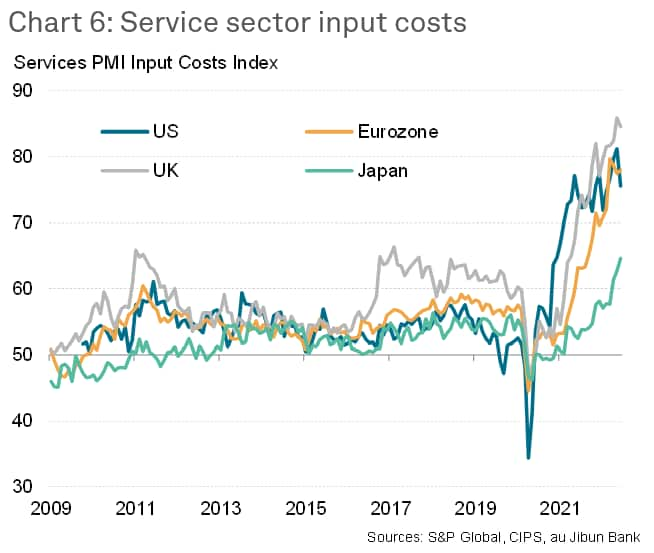
Rates of increase of business costs decelerated in the US, eurozone and UK, with the latter once again seeing a notably firmer rate of increase. Japan bucked the moderating trend, with costs rising at a rate unprecedented since comparable data were available in 2007, though the rate of increase remained far lower than in the US and Europe.
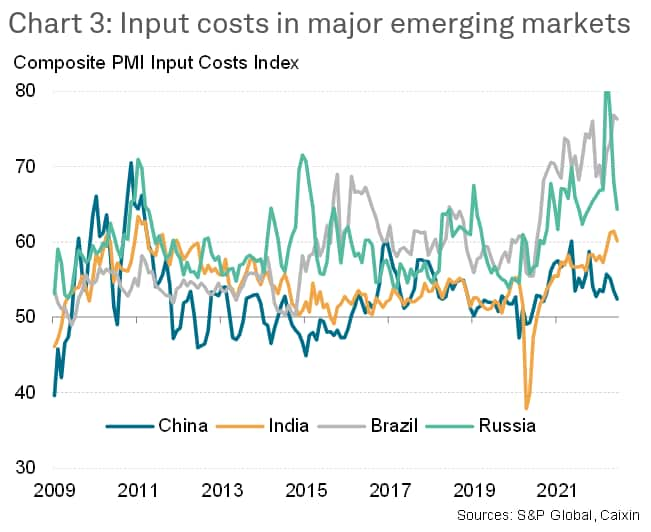
Rates of inflation also cooled across the four major developed markets, though with Brazil's rate of increase remaining historically elevated. Mainland China saw the weakest rate of increase, continuing the trend of far weaker inflation rates than other countries in recent years.
Cost growth again led by services
June saw worldwide input cost inflation in the service sector exceed that of manufacturing for a second month, reversing the trend of manufacturing-led inflation seen throughout much of the prior post-pandemic period. Although rates of increase moderated in both sectors at the end of the second quarter, in both cases rates of increase remained among the fastest seen in the survey history.
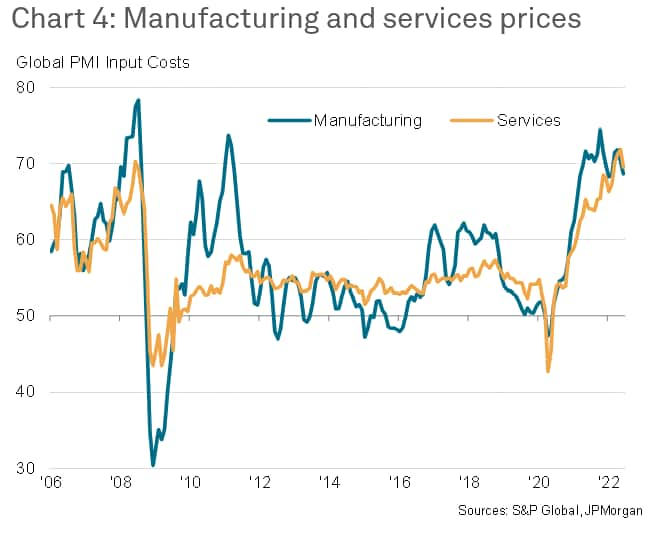
These slower - yet still elevated - rates of input cost inflation within manufacturing and services were common to all major developed economies with the exception of Japan, which saw service sector input costs rise at an accelerated rate.
Fewer supply shortages
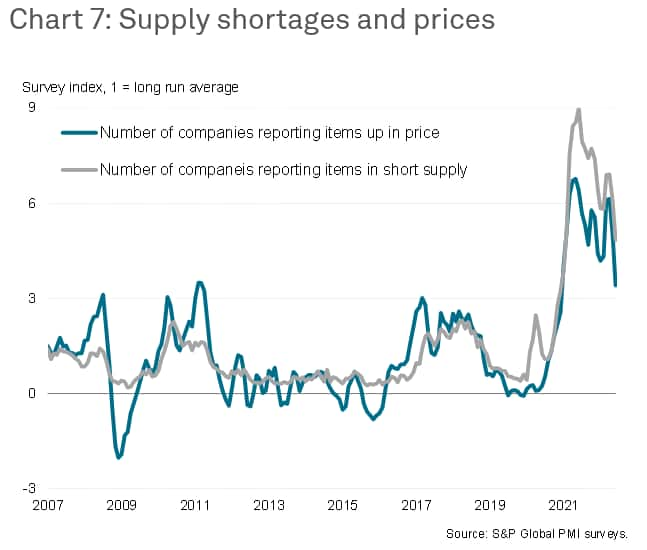
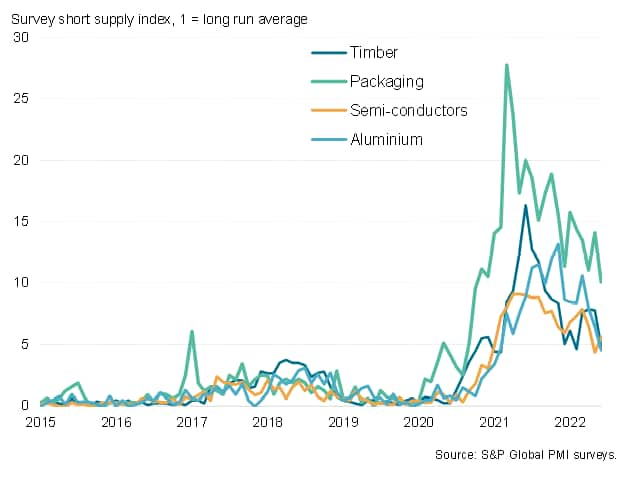
A key driver of the slower rate of manufacturing input cost increase in June was a further moderation in the number of supply shortages, which reduced suppliers' pricing power. Measured globally, the number of companies reporting any items to have been in short supply has been trending lower over the past year and fell further in June to hit the lowest since January 2021.
Meanwhile the number of companies reporting items to have risen in price has also fallen in recent months, dropping in June to the lowest since December 2020 (see chart 7).
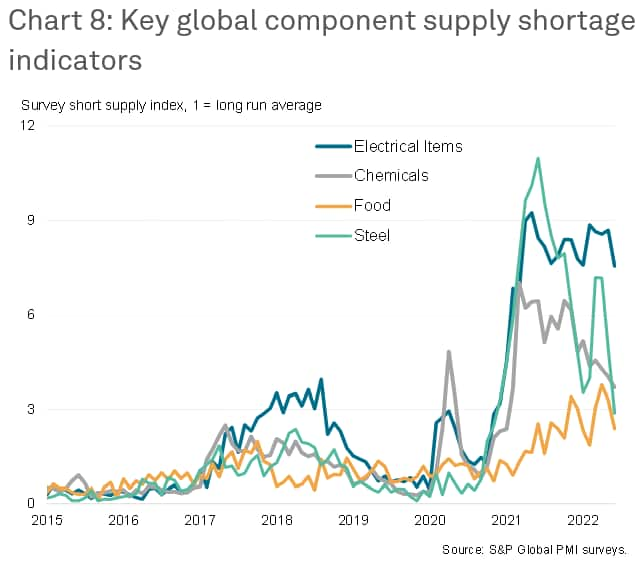
Supply shortages generally remain significantly above long-run averages and, in the case of semiconductors, even worsened in June, but appear to have moderated for a wide array of key inputs, including general electrical components, chemicals, timber, packaging, steel, aluminium and even food.
Weaker demand and less inventory building takes pressure off manufacturing prices
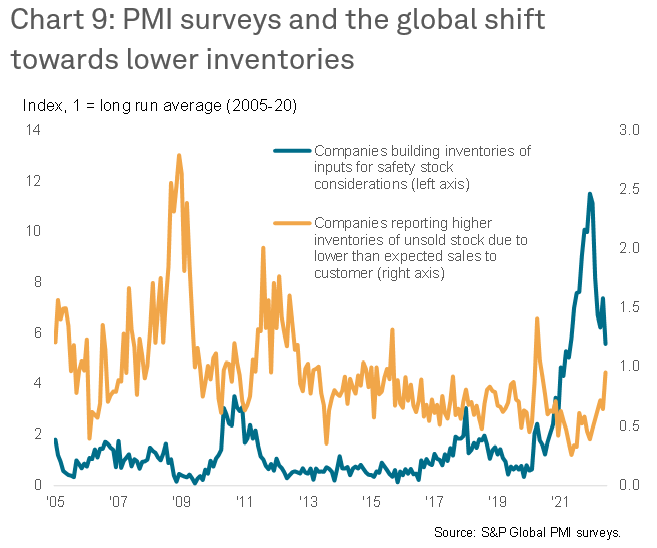
The easing in supply chain delays is associated with a cooling of demand growth in manufacturing, which is in turn linked to slower than anticipated sales to customers in many cases, but also reflects a growing trend of firms moving away from safety stock building towards destocking, designed to cut costs in the face of an economic slowdown (see chart 9).
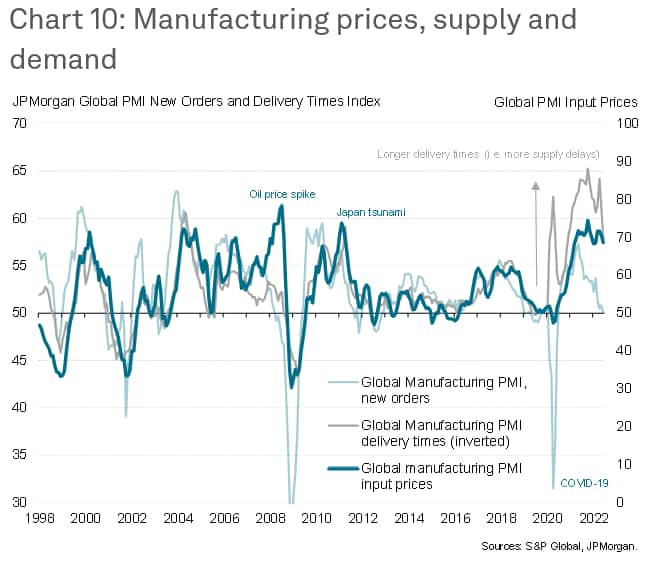
The impact of fewer supply delays and weakened manufacturing demand on industrial prices is further illustrated by chart 10 and explored in more detail in our recent analysis of the global manufacturing sector. The current situation appears to be one of persistent - albeit moderating - supply shortages providing the main support to prices, offsetting to some extent the drag from weakened demand.
Energy costs bring new pressures
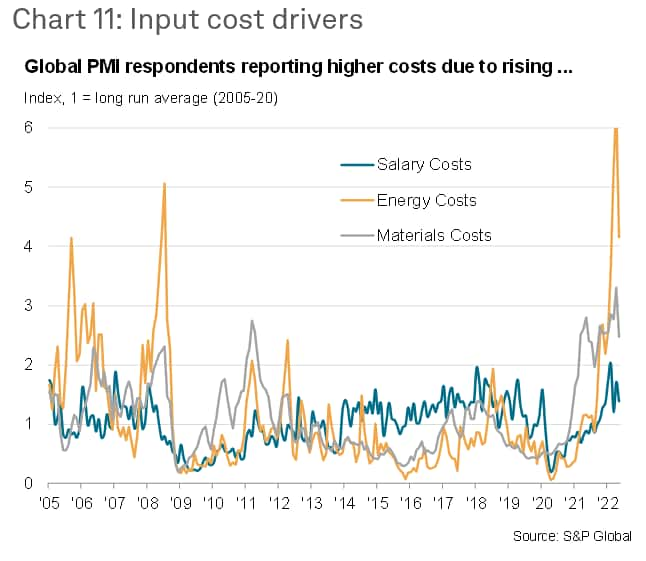
Supply chain price pressures on materials meanwhile continues to be accompanied by upward pressure on costs from energy and wages. However, June's PMI surveys showed that even wage and energy cost-push inflation showed signs of cooling, though clearly also remains highly elevated by historical standards.
Outlook as fundamentals of higher inflation show signs of peaking
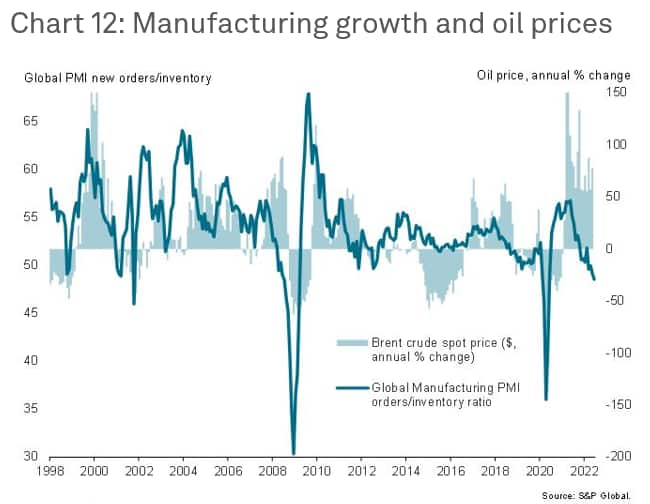
As chart 10 illustrates, the fundamental supply and demand factors supporting higher industrial prices are showing signs of weakening. The key persistent drivers of inflation in coming months are therefore likely to be energy and wages. However, it remains to be seen how long energy - not including European gas prices - can remain high for, given the rising risk of recession. As chart 12 shows, it would be unusual for oil prices to not fall in the current manufacturing climate. At the time of writing, oil futures are already coming under pressure from the weak PMI data for June.
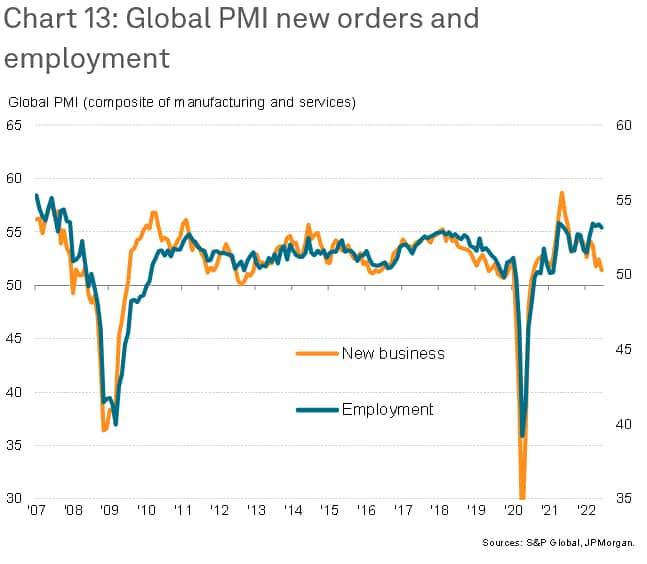
As for wage growth, labour markets remain tight and there have been rising incidences around the world of upward wage negotiating power linked to strikes. However, even these labour market pressures could soon moderate if global demand for goods and services continues to falter. As chart 13 shows, it would be unusual for hiring to remain at current levels in the face of the weakening of demand seen in recent months (read more in our global overview here).
Inflation outlook: this time is different
While input cost inflation remains elevated, there are indications that the recent easing in the rate of inflation will intensify in the coming months, unlike the prior two blips seen during the pandemic when weaker inflationary pressures soon reaccelerated.
First, the recent slowdown in demand is far greater than seen at any time other than the initial COVID-19 lockdowns and, importantly, has this time not been caused by heightened pandemic containment measures (see chart 10).
Second, the recent easing of price pressures is associated with a substantial moderation of supply chain delays (see charts 7 and 10).
Third, the cooling of final demand is being accompanied by a shift away from inventory building, contrasting with prior months during the pandemic, which will further reduce demand-pull pressure in input prices (see chart 9)
Fourth, the recent slowdown is driving a steep pull-back in forms' expectations of growth prospects, which have now fallen to their lowest since September 2020 as measured by the global PMI's future output expectations index. This drop in confidence is in turn likely to take pressure off labour demand, and wages, as well as feeding through to weaker output growth in coming months, all of which will further help reduce inflationary pressures
A key uncertainty remains the outlook for energy prices, especially in Europe amid the Ukraine war, but even energy prices are now coming under pressure from the worsening economic outlook, providing further evidence to suggest that the annual rate of CPI inflation will start to moderate - potentially substantially - in the second half of 2022.
Chris Williamson, Chief Business Economist, S&P Global Market Intelligence
Tel: +44 207 260 2329
chris.williamson@spglobal.com
© 2022, IHS Markit Inc. All rights reserved. Reproduction in whole
or in part without permission is prohibited.
Purchasing Managers' Index™ (PMI™) data are compiled by IHS Markit for more than 40 economies worldwide. The monthly data are derived from surveys of senior executives at private sector companies, and are available only via subscription. The PMI dataset features a headline number, which indicates the overall health of an economy, and sub-indices, which provide insights into other key economic drivers such as GDP, inflation, exports, capacity utilization, employment and inventories. The PMI data are used by financial and corporate professionals to better understand where economies and markets are headed, and to uncover opportunities.
This article was published by S&P Global Market Intelligence and not by S&P Global Ratings, which is a separately managed division of S&P Global.
