Customer Logins
Obtain the data you need to make the most informed decisions by accessing our extensive portfolio of information, analytics, and expertise. Sign in to the product or service center of your choice.
Customer Logins
ECONOMICS COMMENTARY
Oct 04, 2019
Global growth joint-lowest in three-year lows
- Global PMI™ slips to 51.2 in September
- Trade-led slowdown spreads further to services
- New business inflows lowest since 2012
- Jobs growth stalls
- Investment indicators at lowest since 2012 in Q3
Latest worldwide PMI data showed the global economy losing growth momentum again in September, registering the joint-weakest increase in output for three years. Inflows of new orders slipped to the lowest since 2012 and business expectations about the year ahead remained close to survey lows.
Key to the recent malaise has been a further spill-over of the trade-led slowdown from manufacturing to services, the latter now running at three-year lows. Trade worries continued to dominate the outlook, alongside heightened uncertainty and worries of weaker economic growth.
Two consequences of the deteriorating growth picture have been a stalling of jobs growth to the weakest since early-2010, and a sharp downturn in business investment, which fell in the third quarter to the greatest extent since 2012.
Global growth at three-year low
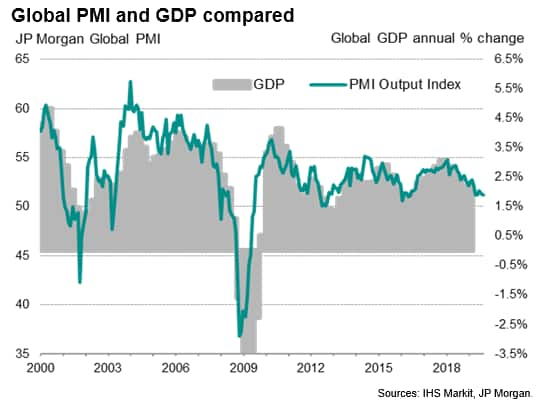
At 51.2 in September, the JPMorgan Global PMI™ (compiled by IHS Markit) fell to a level matching the three-year lows seen back in May and June. The index, which measures changes in total output across both manufacturing and service, provides an accurate advance guide to worldwide GDP growth and hints that the annual pace of global economic growth (at market prices) has slowed to just below 2% in recent months, down markedly from 3% at the end of 2017.
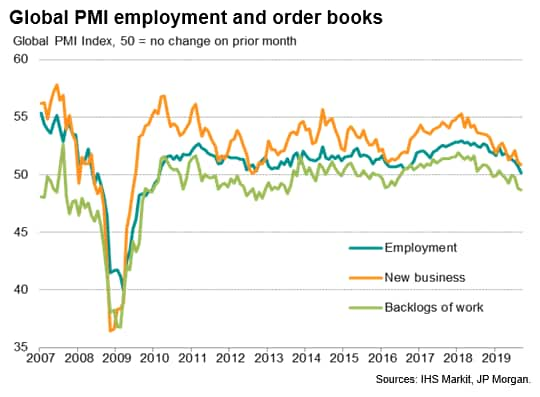
The slowdown reflected a further deterioration of inflows of new business in September, which showed the smallest monthly rise since November 2012, underscoring how growth of global demand for goods and services has cooled markedly in recent months.
With backlogs of work now falling at the sharpest pace since July 2013, hinting at excess capacity, companies have also pared back their hiring. Global jobs growth all but stalled in September, the smallest of possible gains representing the smallest rise since February 2010. The weakening jobs growth, from robust gains seen earlier in the year, has been a key transmission mechanism by which the trade-led manufacturing slowdown has spread to the service sector, which is typically more dependent on domestic demand and household spending.
Spill-over to services
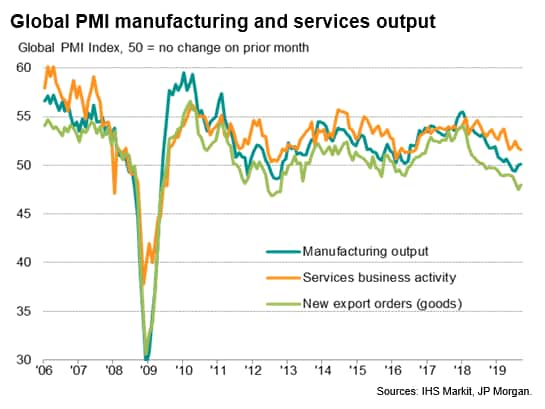
Earlier this year, a largely stalled manufacturing economy contrasted with a relatively resilient service sector. However, while manufacturing continued to stagnate in September, service sector growth slowed to the joint-weakest for three years.
Similarly, while manufacturers reported a fall in new orders for the sixth time in the past seven months in September, inflows of new business in the service sector slowed to the weakest since March 2016.
Trade woes
A further slowdown in trade was also apparent, with global exports of goods and services dropping for a tenth successive month in September, declining in the third quarter at the steepest rate since comparable data covering both sectors were first available in 2014.
Global goods exports fell in the third quarter at a rate not seen since 2012, down for a thirteenth successive month. But services exports also fell in September, dropping for a second month in a row and deteriorating at the fastest rate since at least 2014.
Darkened outlook
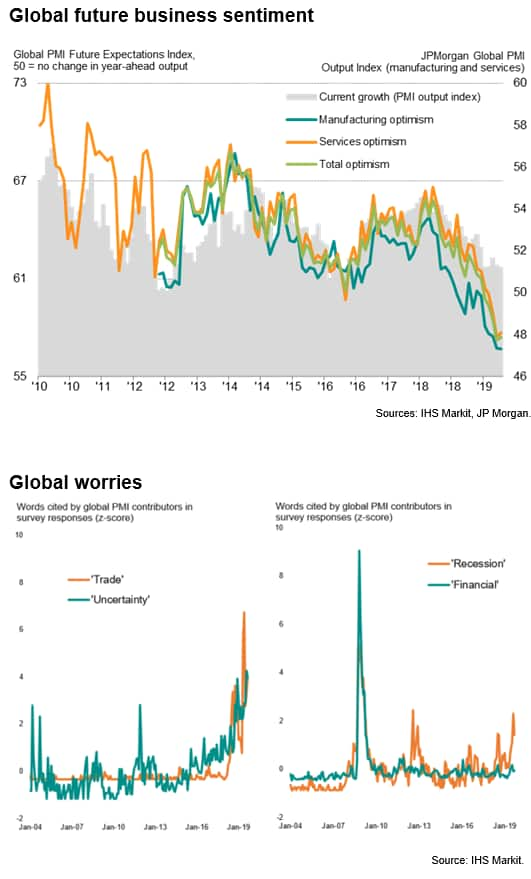
The disappointing readings on the current output and order book situations were matched by gloomy sentiment among both manufacturing and service sector companies about prospects in the year ahead. Expectations of output were collectively the second lowest on record (data were first available in 2012), with only August having witnessed gloomier sentiment, suggesting weakness has further to run.
Looking at the reasons given by companies for negative survey responses (either in terms of falling output, orders or exports, or for gloomier sentiment about the year ahead), recent months have seen record levels of both 'trade' and 'uncertainty' being cited by PMI respondents.
Concerns over weaker growth and 'recession' have also risen sharply, albeit with some easing seen in September, often linked in part to hopes that recent policy stimulus from central banks will help avert further weakness.
Business investment falling at fastest rate since 2012
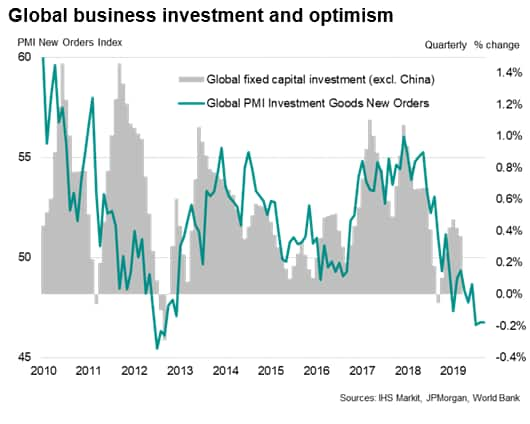
In addition to firms reining-in their hiring, the global PMI data also showed signs of business investment falling sharply. A key PMI gauge of new orders for investment goods has been running at its lowest since 2012 throughout the third quarter. This index correlates well with official business investment spending data, providing an advance guide to global capex trends. The current picture of falling investment is a far cry from the surge in spending seen at its peak early last year.
The investment goods downturn highlights how the global slowdown and darkened outlook has hit capital spending by companies, which could in turn dampen future growth and productivity.
Looser policy
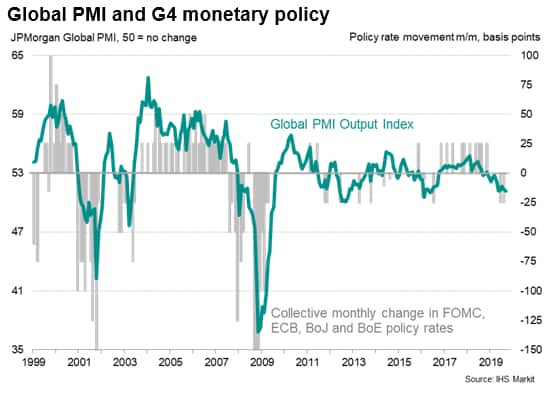
As well as correlating well with GDP, the global PMI also provides a useful guide to monetary policy. Tracking the global PMI's output index against interest rate cuts and hikes form the G4 economies' central banks, PMI readings above 53 are approximately consistent with a shift to hawkish policy whereas readings below 53 denote a shift to dovish policy. With the PMI having been below 53 since last December, and falling further in recent months, it is not surprising to have seen central banks turn on more stimulus. The latest readings suggest further stimulus could be on the cards.
Chris Williamson, Chief Business Economist, IHS Markit
Tel: +44 207 260 2329
chris.williamson@ihsmarkit.com
© 2019, IHS Markit Inc. All rights reserved. Reproduction in whole or in part without permission is prohibited.
Purchasing Managers' Index™ (PMI™) data are compiled by IHS Markit for more than 40 economies worldwide. The monthly data are derived from surveys of senior executives at private sector companies, and are available only via subscription. The PMI dataset features a headline number, which indicates the overall health of an economy, and sub-indices, which provide insights into other key economic drivers such as GDP, inflation, exports, capacity utilization, employment and inventories. The PMI data are used by financial and corporate professionals to better understand where economies and markets are headed, and to uncover opportunities.
This article was published by S&P Global Market Intelligence and not by S&P Global Ratings, which is a separately managed division of S&P Global.
{"items" : [
{"name":"share","enabled":true,"desc":"<strong>Share</strong>","mobdesc":"Share","options":[ {"name":"facebook","url":"https://www.facebook.com/sharer.php?u=http%3a%2f%2fwww.spglobal.com%2fmarketintelligence%2fen%2fmi%2fresearch-analysis%2fglobal-growth-lowest-in-three-years-Oct19.html","enabled":true},{"name":"twitter","url":"https://twitter.com/intent/tweet?url=http%3a%2f%2fwww.spglobal.com%2fmarketintelligence%2fen%2fmi%2fresearch-analysis%2fglobal-growth-lowest-in-three-years-Oct19.html&text=Global+growth+joint-lowest+in+three-year+lows+%7c+S%26P+Global+","enabled":true},{"name":"linkedin","url":"https://www.linkedin.com/sharing/share-offsite/?url=http%3a%2f%2fwww.spglobal.com%2fmarketintelligence%2fen%2fmi%2fresearch-analysis%2fglobal-growth-lowest-in-three-years-Oct19.html","enabled":true},{"name":"email","url":"?subject=Global growth joint-lowest in three-year lows | S&P Global &body=http%3a%2f%2fwww.spglobal.com%2fmarketintelligence%2fen%2fmi%2fresearch-analysis%2fglobal-growth-lowest-in-three-years-Oct19.html","enabled":true},{"name":"whatsapp","url":"https://api.whatsapp.com/send?text=Global+growth+joint-lowest+in+three-year+lows+%7c+S%26P+Global+ http%3a%2f%2fwww.spglobal.com%2fmarketintelligence%2fen%2fmi%2fresearch-analysis%2fglobal-growth-lowest-in-three-years-Oct19.html","enabled":true}]}, {"name":"rtt","enabled":true,"mobdesc":"Top"}
]}


