Customer Logins
Obtain the data you need to make the most informed decisions by accessing our extensive portfolio of information, analytics, and expertise. Sign in to the product or service center of your choice.
Customer Logins
BLOG
Nov 05, 2018
IHS Markit European loan volume survey Q3 2018
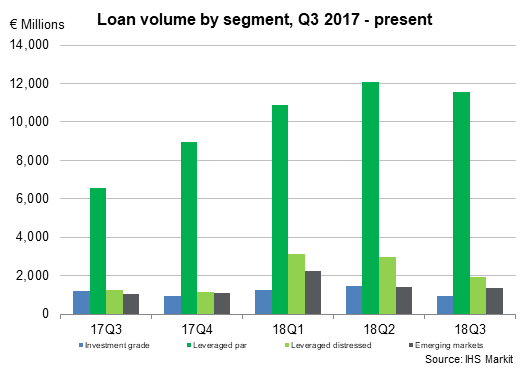
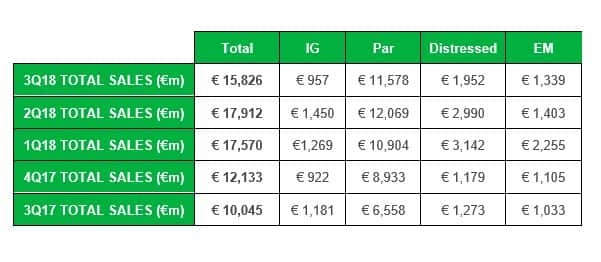
After three consecutive quarters of increasing totals and record highs, trade volumes for Q3 seem to have ebbed slightly. Total sales for Q3 totalled €15,286m, which is 11.7% lower than the €17,912m recorded in Q2 but they are still just over 50% higher than €10,045m seen in Q3 2017.
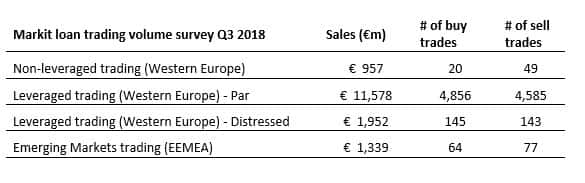
- Leveraged loan trades in Western Europe constituted 85.5% of the volumes, which is up on the 84.1% observed in the previous quarter and also up on the 78% in Q3 2017. Of the 85.5% this quarter, 73.2% was conducted on LMA Par documentation, compared against 12.3% on LMA Distressed documentation.
- European Investment Grade loan volumes represented 6% of the total, which is lower than the 8.1% seen last quarter and quite a bit lower than the 11.8% we recorded in Q3 2017.
- Emerging Market figures (Eastern Europe, Middle East and Africa) represented 8.5% this quarter, which was slightly down on the 12.8% we saw last quarter, but higher than the 6% we saw at this time in 2017.
Survey results
As well as total volumes, figures in all segments were down in Q3. The largest drops were seen in the Investment Grade and Distressed segments. The former was down by 34% from €1,450m in Q2 to €957m this quarter and down 19% from €1,181m in Q3 2017. The latter was down by a similar 34.7% from €2,990m in Q2 to €1,952m in Q3. However, this was 53.3% higher than the €1,273m in Q3 2017. Par and Emerging Market figures were both down by similar amounts as well. Par figures dropped 4% from €12,609m in Q2 to €11,578m in Q3 but still up 75.6% on the €6,558m in Q3 2017. Emerging markets only dropped 4.5% from €1,403m in Q2 to €1,339m in Q3. This was 29.6% higher than the €1,033m in Q3 2017.
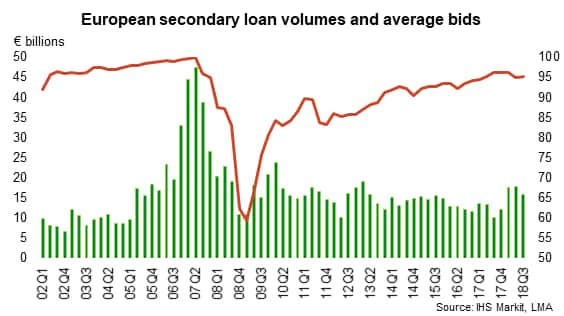
The average bid as of the last day of September stood at 95.22, which is up on the 95.02 recorded at the end of Q2 but down on the 96.16 at the end of Q3 2017. The average bid for the quarter was 95.12 down both on the Q2 average of 95.8 and Q3 2017 average of 95.78.
Number of trades by market segment
Breakdown by participation
Buy volumes were again down across the board. Sellside and buyside were down 8% and 5% respectively although the number of trades was up. Sales amongst the sellside were down 6% whereas sales among the buyside were down over 33%. Total buys were down 7% against a drop in 13.5% in total sales.
Period | Sellside | Buyside | Total | Total buy trades |
Q3 2018 buys | € 11,463,371,169 | € 5,821,060,236 | € 17,284,431,405 | 5085 |
Q2 2018 buys | € 12,436,123,578 | € 6,113,925,503 | € 18,550,049,081 | 4550 |
Q1 2018 buys | € 14,340,305,084 | € 7,245,008,722 | € 21,585,313,805 | 5059 |
Q4 2017 buys | € 9,432,054,223 | € 6,501,829,132 | € 15,933,883,355 | 4709 |
Q3 2017 buys | € 10,613,795,076 | € 5,438,248,782 | € 16,052,043,858 | 3860 |
Period | Sellside | Buyside | Total | Total sale trades |
Q3 2018 sales | € 12,243,090,120 | € 3,257,081,829 | € 15,500,171,949 | 4854 |
Q2 2018 sales | € 13,032,187,089 | € 4,879,624,411 | € 17,911,811,500 | 5015 |
Q1 2018 sales | € 13,303,391,036 | € 4,266,745,729 | € 17,570,136,766 | 4391 |
Q4 2017 sales | € 8,925,313,598 | € 3,206,938,125 | € 12,133,251,723 | 3665 |
Q3 2017 sales | € 8,215,445,929 | € 1,829,192,967 | € 10,044,638,896 | 2702 |
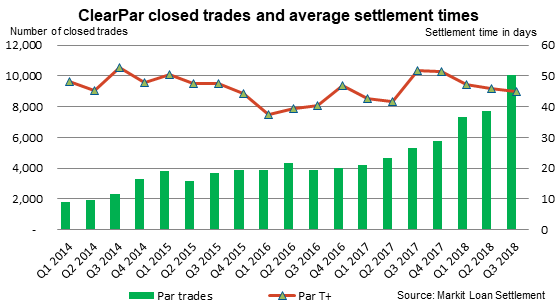
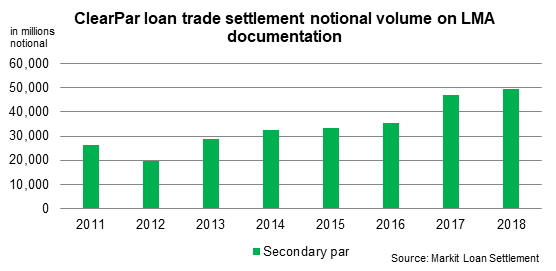
Markit Loan Settlement volumes
Activity in the European loan market has seen consistent growth over the past 18 months, and Q3 2018 showed no signs of that stopping. There was once again record LMA secondary par trading volume settling through ClearPar during the summer months, with numbers up by as much as 30% compared to Q2 2018 and almost double that of the same period 12 months prior. This additional activity saw over 18bn in notional changing hands in the secondary market alone. This jump in secondary activity points to a buoyant market, and albeit only by 1.1 days, the average settlement time for secondary par trades did fall in Q3 despite such a large increase in trading volume. Again, these are positive signs that progress is being made to facilitate continued growth. All eyes on Q4 to see whether these volumes remain, with much relying on the continued availability of new issuance to meet the markets appetite.
Contributors
A total of 21 buyside and sellside institutions participated in this survey.
|
|
|
For more information, please contact:
Rory McSwiggan, Loan Pricing, IHS Markit
James Irwin, Loan Settlement, IHS Markit
S&P Global provides industry-leading data, software and technology platforms and managed services to tackle some of the most difficult challenges in financial markets. We help our customers better understand complicated markets, reduce risk, operate more efficiently and comply with financial regulation.
This article was published by S&P Global Market Intelligence and not by S&P Global Ratings, which is a separately managed division of S&P Global.
{"items" : [
{"name":"share","enabled":true,"desc":"<strong>Share</strong>","mobdesc":"Share","options":[ {"name":"facebook","url":"https://www.facebook.com/sharer.php?u=http%3a%2f%2fwww.spglobal.com%2fmarketintelligence%2fen%2fmi%2fresearch-analysis%2feuropean-loan-volume-survey-q3-2018.html","enabled":true},{"name":"twitter","url":"https://twitter.com/intent/tweet?url=http%3a%2f%2fwww.spglobal.com%2fmarketintelligence%2fen%2fmi%2fresearch-analysis%2feuropean-loan-volume-survey-q3-2018.html&text=S%26P+Global+European+loan+volume+survey+Q3+2018+%7c+S%26P+Global+","enabled":true},{"name":"linkedin","url":"https://www.linkedin.com/sharing/share-offsite/?url=http%3a%2f%2fwww.spglobal.com%2fmarketintelligence%2fen%2fmi%2fresearch-analysis%2feuropean-loan-volume-survey-q3-2018.html","enabled":true},{"name":"email","url":"?subject=S&P Global European loan volume survey Q3 2018 | S&P Global &body=http%3a%2f%2fwww.spglobal.com%2fmarketintelligence%2fen%2fmi%2fresearch-analysis%2feuropean-loan-volume-survey-q3-2018.html","enabled":true},{"name":"whatsapp","url":"https://api.whatsapp.com/send?text=S%26P+Global+European+loan+volume+survey+Q3+2018+%7c+S%26P+Global+ http%3a%2f%2fwww.spglobal.com%2fmarketintelligence%2fen%2fmi%2fresearch-analysis%2feuropean-loan-volume-survey-q3-2018.html","enabled":true}]}, {"name":"rtt","enabled":true,"mobdesc":"Top"}
]}