Customer Logins
Obtain the data you need to make the most informed decisions by accessing our extensive portfolio of information, analytics, and expertise. Sign in to the product or service center of your choice.
Customer Logins
BLOG
Apr 01, 2018
Accelerating CVA calculations using Quasi Monte Carlo Methods
One of the most important counterparty credit risk measures is the credit valuation adjustment (CVA), defined as the present value of the potential loss due to a counterparty failing to meet their contractual obligations. Risk neutral pricing states that the present value is equal to the expected value of the payoff using risk adjusted probabilities. The payoff in this case is the netted portfolio value less collateral (floored at zero) at the time of counterparty default, multiplied by one minus the recovery rate. The payoff is at counterparty level, potentially path dependent (collateral, early exercise conditions, lags between fixings and cash flows), and subject to change. The expectation of high dimensional, fluid payoffs of this sort must be estimated with Monte Carlo (MC) simulation (see Gregory 2015 [7]).
Monte-Carlo estimation of an expectation involves randomly sampling the payoff times according to the risk neutral probabilities and averaging the results. The estimate approaches the true expectation with probability 1 with a normally distributed error with zero mean and standard deviation equal to the standard deviation of the payoff (a constant) divided by the square root of the number of replications used [6]. Requiring the error to be on average 100 times smaller than the standard deviation of the CVA payoff requires 10,000 replications, a number typically used. This highlights the main disadvantage of MC: its computational expense.
This is of particular importance in the context of CVA where each evaluation of the payoff is also computationally expensive. Consider a bank with 100,000 trades that uses 200 exposure dates in the time discretization. One replication of the CVA payoffs across all counterparties requires roughly 10,000,000 trade prices (assuming trade maturities are evenly distributed) and thus one MC CVA estimate using 10,000 paths requires of the order of 100,000,000,000 trade price evaluations. Furthermore, many banks risk manage these credit adjustments, and to do so requires the calculation of the derivatives of the CVA with respect to the market prices of the instruments used to hedge it. Bump and run techniques require at least one full MC CVA calculation per derivative. 200 derivatives bring the computational load up to 20,000,000,000,000 trade price evaluations per day.
Not surprisingly, quants have been searching for ways to
accelerate this massive calculation. One successful line of
research uses algorithmic adjoint differentiation (AAD) to compute
the derivatives, reducing the computational burden to a fixed
multiple
(5 to 10 times depending on the problem and memory handling) of the
baseline CVA calculation, no matter how many derivatives are
required (see Capriotti et al. 2011 [4] for more information).
Assuming a conservative fixed multiple of 10, this would reduce the total number of calculations by a factor of 20, requiring 1,000,000,000,000 trade price evaluations. This dramatic improvement, however, does not come for free. The implementation of an AAD enabled system requires large changes to existing code libraries, requiring a significant upfront investment to implement. As a consequence, many still compute the derivatives using bump and run techniques.
In another line of research, Ghamami and Zhang 2014 [5] highlight that direct and independent simulation of the portfolio value to each time step diversifies the errors in each time bucket, leading to a significant reduction of the standard error of the final sum across time. The benefit of the direct simulation approach is reduced if simulating to each time step independently is more computationally expensive than simulating to each step sequentially using a common simulation path. Highly path dependent portfolios containing collateral may not benefit as a result, but the technique looks quite promising for portfolios of uncollateralized vanillas.
In a similar line of research, Burnett, O'Callaghan and Hulme 2016 [2] note that the computational expense of calculating valuation adjustment risks (derivatives) vary significantly across different counterparties, and that the computational expense is uncorrelated with the size of the adjustment error. This opens up the possibility to optimally allocate computational resources where they are needed most, using a different number of paths and/or time steps for different counterparties and risks. They formalize this idea by setting up and minimizing the expected unexplained PnL by varying the number of paths and frequency of time steps allocated to each counterparty and risk, subject to a computational time constraint. The acceleration they report computing FVA on a sample Barclays portfolio is impressive, roughly in line with the acceleration provided by AAD.
In a forthcoming IHS Markit research paper, we explore yet another acceleration technique used to price payoffs called quasi Monte Carlo (QMC). The mechanics are identical to classical Monte Carlo simulation with the exception that the pseudo random numbers (PRN) are replaced with carefully selected low discrepancy (number) sequences (LDS) that are more evenly distributed, with the hope of improving the convergence rate closer to the optimal . In the paper, we estimate CVA and CVA sensitivities of several portfolios of vanilla interest rate swaps, ranging from single currency single trade portfolios, to nettings sets containing eleven different currencies, all with a multi-currency, multi-curve extension to the Hull-White model [8] with deterministic hazard rates.
We find that QMC with Sobol' sequences [9], Broda's 65,536 direction numbers [1], and the Brownian bridge discretization [3], with on average 1,197 paths produces errors roughly equivalent in size to classical MC with 10,000 simulations, a factor of 8 acceleration.
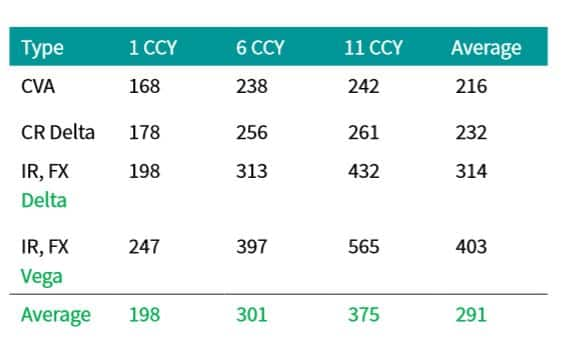
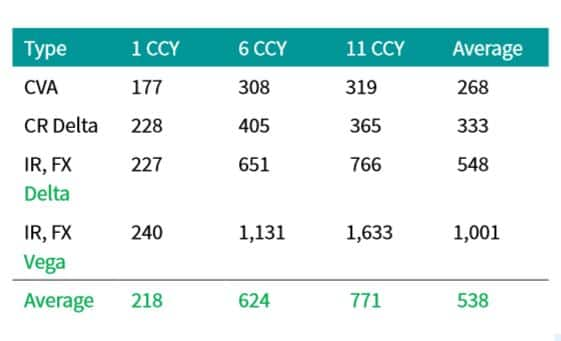
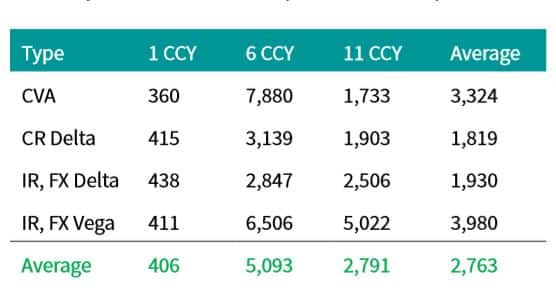
The number of paths needed to match classical MC with 10,000 paths varies significantly between portfolios and calculation type, however, increasing as the portfolio becomes more out of the money (291 paths for far in the money, 538 paths for at the money, and 2,763 for far out of the money). The gains are most impressive when the CVA, the CVA sensitivities, and the corresponding standard errors are the largest (in the money portfolios) and more modest when the standard errors are the smallest (out of the money portfolios). For all but the far out of the money portfolio, the equivalent number of paths increase as more factors are added to the portfolio (208 paths for single trade single currency, 463 paths for six trade six currency portfolio, and 573 paths for the eleven trade eleven currency portfolio), and for more complex calculations (242 for CVA MTM, 282 for CR delta, 431 for IR and FX delta, and 702 for IR and FX vega). Illustrative results for in the money and at the money portfolios are presented in tables 1 and 2. Far out of the money portfolios are the most difficult and erratic, as indicated by the numbers in table 3.
Table 1: Approximate number of QMC + BB paths
needed to produce CVA and CVA sensitivities with errors roughly
equivalent to classical MC with 10,000
paths for far in the money portfolios of various sizes (one 10 year
fixed rate payer swap in each currency). Fixed rates set to par -
300 basis points.
Table 2: Approximate number of QMC + BB paths
needed to produce CVA and CVA sensitivities with errors roughly
equivalent to classical MC with 10,000 paths for at the money
portfolios of various sizes (one 10 year fixed rate payer swap in
each currency). Fixed rates set to par.
Table 3: Approximate number of QMC + BB paths
needed to produce CVA and CVA sensitivities with errors roughly
equivalent to classical MC with 10,000 paths for far out of the
money portfolios of various sizes (one 10 year fixed rate payer
swap in each currency). Fixed rates set to par + 300 basis
points.
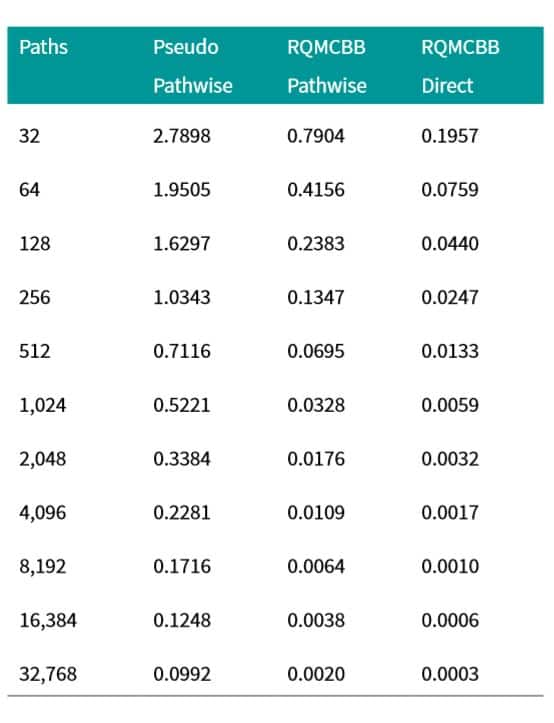
The various acceleration approaches presented above are not mutually exclusive: they can be used together to compound the computational savings. One potentially interesting combination we have just started to explore is to combine the direct simulation methods proposed by Ghamami 2014 [5] for non-collateralized CVA calculations with QMC and the Brownian Bridge mechanism, allowing us to first reduce the effective dimension of each term of the summed CVA, and second, when combined with a randomization method such as digital shift ([6]), diversify the errors across the time axis. We provide some early convergence results in table 4. The results are very promising indeed.
Table 4: CVA error for an at the money 10 year
USD fixed for float swap with $10,000 notional for various numbers
of simulation paths. Three methodologies are presented. Classical
MC, randomized QMC + BB (RQMCBB) with regular pathwise simulation,
and randomized QMC + BB (RQMCBB) with direct and independent
simulation of the risk factors to each time step.
References
- http://www.broda.co.uk/
- Burnett, Benedict and O'Callaghan, Simon C and Hulme, Tom, Risk Optimisation: Finding the Signal in the Noise (May 26, 2016). Available at SSRN: https://ssrn.com/abstract=2784702 or http://dx.doi.org/10.2139/ssrn.2784702
- Caflisch RE, Morokoff WJ, Owen A.B. Valuation of mortgage backed securities using Brownian bridges to reduce effective dimensions. Journal of Computational Finance, 1(1):27-46 (1997)
- L. Capriotti, J. Lee, and M. Peacock. Real Time Counterparty Credit Risk Management in Monte Carlo. Risk, pages 82-86, May 2011. Available at http://papers.ssrn.com/abstract=1824864.
- Ghamami, S., Zhang, B. Efficient Monte Carlo counterparty credit risk pricing and measurement. Journal of Credit Risk, Volume 10, Number 3:87-133 (Sept 2014
- Glasserman P. Monte Carlo Methods in Financial Engineering, New York: Springer-Verlag, ISBN 0-387-00451-3 (2004)
- Gregory J. The xVA Challenge: Counterparty Credit Risk, Funding, Collateral and Capital, Wiley, ISBN 978-1-119-10941-9 (2015)
- Hull J, White A. Numerical procedures for implementing term structure models. I. Singlefactor models. Journal of Derivatives, 2:37-48 (1994)
- Sobol' IM. On the distribution of points in a cube and the approximate evaluation of integrals, USSR Journal of Computational Mathematics and Mathematical Physics, 16:1332-1337 (1967)
S&P Global provides industry-leading data, software and technology platforms and managed services to tackle some of the most difficult challenges in financial markets. We help our customers better understand complicated markets, reduce risk, operate more efficiently and comply with financial regulation.
This article was published by S&P Global Market Intelligence and not by S&P Global Ratings, which is a separately managed division of S&P Global.
{"items" : [
{"name":"share","enabled":true,"desc":"<strong>Share</strong>","mobdesc":"Share","options":[ {"name":"facebook","url":"https://www.facebook.com/sharer.php?u=http%3a%2f%2fwww.spglobal.com%2fmarketintelligence%2fen%2fmi%2fresearch-analysis%2fcva-calculations-quasi-monte-carlo-methods.html","enabled":true},{"name":"twitter","url":"https://twitter.com/intent/tweet?url=http%3a%2f%2fwww.spglobal.com%2fmarketintelligence%2fen%2fmi%2fresearch-analysis%2fcva-calculations-quasi-monte-carlo-methods.html&text=Accelerating+CVA+calculations+using+Quasi+Monte+Carlo+Methods+%7c+S%26P+Global+","enabled":true},{"name":"linkedin","url":"https://www.linkedin.com/sharing/share-offsite/?url=http%3a%2f%2fwww.spglobal.com%2fmarketintelligence%2fen%2fmi%2fresearch-analysis%2fcva-calculations-quasi-monte-carlo-methods.html","enabled":true},{"name":"email","url":"?subject=Accelerating CVA calculations using Quasi Monte Carlo Methods | S&P Global &body=http%3a%2f%2fwww.spglobal.com%2fmarketintelligence%2fen%2fmi%2fresearch-analysis%2fcva-calculations-quasi-monte-carlo-methods.html","enabled":true},{"name":"whatsapp","url":"https://api.whatsapp.com/send?text=Accelerating+CVA+calculations+using+Quasi+Monte+Carlo+Methods+%7c+S%26P+Global+ http%3a%2f%2fwww.spglobal.com%2fmarketintelligence%2fen%2fmi%2fresearch-analysis%2fcva-calculations-quasi-monte-carlo-methods.html","enabled":true}]}, {"name":"rtt","enabled":true,"mobdesc":"Top"}
]}


