Customer Logins
Obtain the data you need to make the most informed decisions by accessing our extensive portfolio of information, analytics, and expertise. Sign in to the product or service center of your choice.
Customer Logins
BLOG
Feb 25, 2020
Corporate Bond Market Tradable Index Ecosystem
The corporate credit tradable index universe is expanding, both in terms of liquidity and new products. Investment strategies in fixed income credit with index-based products are increasingly the norm given the increase in available options. Exchange traded funds, swap products, such as CDS Indices and total return swaps, and most recently corporate bond futures, have catalyzed the rapid advance of the landscape.
To trade pure credit, that is, the general risk that corporations will not be able to pay their obligations, credit default swap indices such as CDX and iTraxx have long provided a means to get exposure to the risk of debt issuers failure to pay their debtors. CDS indices are extremely liquid and provide a quick, low cost means to trade credit spreads.
Corporate bonds comprise both interest rate and credit risk. Until recently, the only tradable credit beta products to contain both interest rate and credit exposure were ETFs and bespoke total return swaps. However, ETFs must be fully funded, such that if you want to be exposed to $10 million you need to outlay $10 million of cash. Bespoke TRS tend to be illiquid and offered on custom terms in a bilateral agreement and can, therefore, be costly and difficult to exit.
In the interest rate market there exists liquid Treasury futures that could be used to tweak overall corporate bond exposure when paired with a pure credit product like CDX. However, Treasury futures are most liquid around certain tenor points on the curve and adjusting for key rate durations can involve a number of different trades.
CDS indices, total return swaps and futures contracts enable unfunded trading, which allows hedging of existing positions, tweaking exposure and pre-investing known cash flows to reduce cash drag among other uses. They also enable unique investment strategies, like portable alpha and yield enhancement through shrewd collateral management.
Two new tradable index products have changed the landscape of trading unfunded corporate bond market exposure - Standardized Total Return Swaps and corporate bond market futures.
The most liquid structure for standardized TRS is Standardized iBoxx TRS, while corporate bond futures have taken the form of the Cboe iBoxx iShares Bond Index Futures, that trade on the Cboe Futures Exchange. They are highly fungible products- iBoxx TRS has currently 10 market makers, while the Cboe iBoxx iShares Bond Futures have 9 dealers, which results in competitive pricing and liquidity in entering and exiting positions. Both products settle against iBoxx USD High Yield indices, and therefore, like ETFs, near perfectly track and correlate to the cash market.
iBoxx TRS launched in 2012 with four market makers. Over the past decade, volumes and the number of dealers progressively grew to the current market size. iBoxx TRS on $HY and IG has grown by 129% over the past four years, resulting in $71.6bn of notional volumes traded in 2019 (Table 1). For detail into how this market functions, please see my prior blog post here.
Table 1: Standardized iBoxx Total Return Swap Notional Volumes ($
millions)

Certain aspects of iBoxx TRS could make it difficult for particular
market participants to trade. Investors who may be limited from
trading OTC swap products, like certain insurers and pension funds,
may not be able to trade this product.
The newest addition to the tradable index universe are the Cboe iBoxx iShares Bond Index Futures, covering the $HY and IG markets. The Cboe iBoxx iShares $ High Yield Corporate Bond Futures ("IBHY") and Cboe iBoxx iShares $ Investment Grade Corporate Bond Index Futures ("IBIG") can be used to tailor exposure to the high yield and investment markets, respectively.
IBHY began trading mid-September 2018. Since its recent launch, IBHY has averaged $10 million of daily volume and $38 million in open interest (Figure 1). IBIG launched mid-October 2018 and has seen slower adoption to date, with average daily volumes of $0.38 million and $1.25 million of open interest since launch.
Figure 1: IBHY Futures Volumes & Open Interest ($
millions)

Performance/Correlation Across Index Products
Looking from September 10, 2018 when the IBHY futures began trading, to January 31, 2020, USD high yield performance via any of the iBoxx-tracking tradable products was nearly identical (Figure 2)
Figure 2: Total Return across HY Indices & Tradable Products
(Sept. 10, 2018 to Jan. 31, 2020)

The monthly correlation between the index underlying IBHY futures
and the index underlying to HYG and iBoxx TRS was 99.86% over the
period. Further the correlation across IBHY futures prices, HYG
adjusted closes and iBoxx TRS bid prices is nearly 100% (all within
1.5% of 100%). The result is a tradable credit ecosystem that
includes various products delivering the same exposure
(Table 2).
The tradable credit product that is least correlated is CDX HY, for which the CDX HY 5 Year Total Return Index is referenced. The CDX HY 5 Year Total Return Index assumes that the index position is fully funded, with collateral earning the overnight Fed Funds rate. CDX HY is more than 90% correlated to iBoxx HY-based products and indices, though does introduce basis to the cash market.
Table 2: Correlations across HY Indices & Tradable Products
(Sept. 10,2018 to Jan. 31, 2020)

How to Choose
The question becomes, which tradable wrapper best suits the user's purpose? The below table defines some of the key considerations when deciding on which instrument to choose (Table 3).
Table 3: Fixed Income Trading Tool Comparison

In the case of ETFs and iBoxx Futures, both products are traded on
exchange, which has the benefit of providing transparent, real-time
pricing and clearing. This tends to decrease funding costs due to
the elimination of counterparty risk.
In addition to the benefits of price transparency and operational risk reduction that comes from exchange trading, exchange traded products liberalize access for investors who are precluded from trading OTC derivatives that offer identical exposure. The IBHY and IBIG futures liberalize access to the US credit markets by enabling new market participants to benefit from an unfunded tool.
Use CasesNow we turn our attention to a few potential use cases of unfunded iBoxx-based credit products. We will use the IBHY futures as an example. However, the IBIG futures and iBoxx TRS can be used in a similar manner.
Hedging
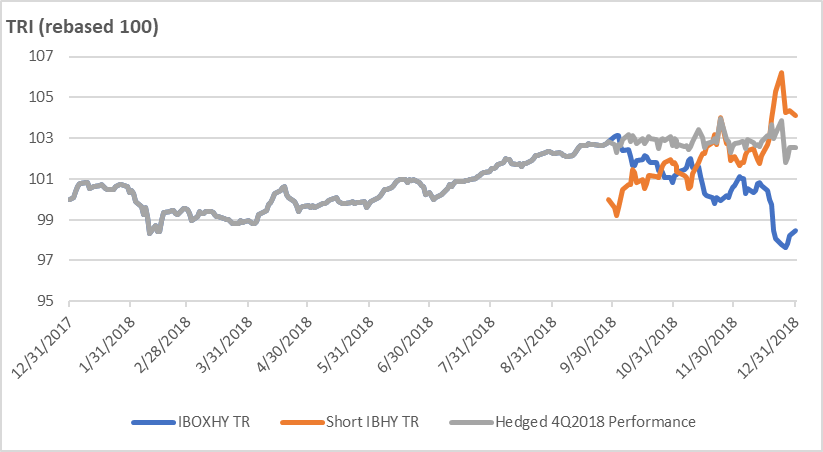
Let's take the case of an active high yield fund manager at the end of the third quarter 2018, who began the year with $500 million of AUM. The portfolio manager has a view that credit will deteriorate for the remainder of the year and wants to go "risk off." However, she thinks the deterioration will be temporary and wants to keep her holdings as the basis for her 2019 portfolio.
If we ignore alpha and only consider her beta exposure to HY, weathering the storm would have resulted in a negative 1.51% return for 2018, while implementing a hedge using IBHY at the start of the fourth quarter of 2018 would have resulted in a 4.04% gain (Figure 3).
Figure 3: Hedged vs Unhedged 4Q2018 - 2018 performance

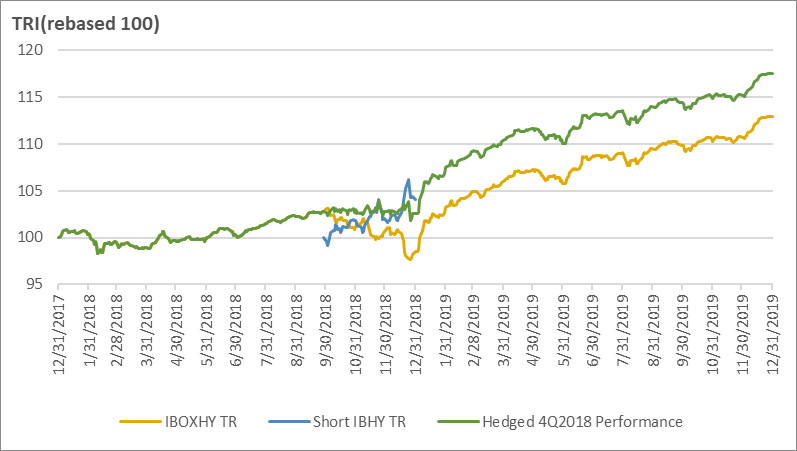
In 2019, performance would be identical had the manager hedged the
prior fourth quarter or not. However, due to different starting
capital from the prior year, the outperformance of the hedged
4Q2018 strategy would result in a 60 basis point greater 2-year
return due to the starting 2018 capital balance (Figure
4).

A summary of differences in dollar terms can be viewed in the
following table (Table 4).
Table 4: Capital Impact -Hedged vs Unhedged
4Q2018

Further, the above strategy would have effectively equitized the
portfolio manager's book into cash for the duration of the fourth
quarter. She could have then used the freed-up capital to place a
separate position, though was wise to remain in cash, which was
2018's best performing asset class.
Manage Cash Flows
Let's look at a different high yield manager who receives $250 million of funds from a new client on December 31, 2018. The client is a pension fund that is primarily concerned with receiving USD HY beta exposure from the funds, which was determined as part of a broader strategic asset allocation that is set with other managers. The pension fund also wants to receive noncorrelated alpha, which was one of their reasons for selecting the manager, who has a good track record of discerning good from bad credits.
The manager's process of sourcing favorable positions, however, takes half a year. He can invest 50% of the capital immediately, and then 10% per month as he spots favored credits.
Again, we will ignore alpha. Without the assistance of an unfunded product, the portfolio manager would not be fully invested until the beginning of June, missing 5 months of full market participation. His return with cash drag would have been 10.85%, 3.69% less than the 14.53% return he would have received if using IBHY to get market exposure to 100% while sourcing positions. The 14.53% return is then only 12 basis points less than the 14.65% return from the underlying index, representing the cost of implementing the strategy using futures (Figure 5).
Figure 5: New Cash Flow - 50% Invested day 1, 10% monthly phase
in

A summary of differences in dollar terms can be viewed in the
following table (Table 5).
Table 5: Capital Impact -IBHY to limit cash drag

Conclusion
This diverse ecosystem of tradable indices has resulted in ancillary benefits to the market. One example is the enhanced ability to price underlying bonds and issuers. Where an index trades, there is also an implied value for each underlying holding. This improved pricing ability has resulted in the practice of portfolio trading, whereby market participants exchange a bespoke basket of bonds in a single trade. This new business line is further supported by the various tradable index products that can be used to hedge these transactions.
The tradable credit index ecosystem looks set to continue its expansion, both in terms of liquidity and products offerings. Investors can tailor exposure using pure rate, pure credit and all-in credit and rate corporate bond market replicating products. The effect has improved market transparency, pricing and efficiency in the market.
S&P Global provides industry-leading data, software and technology platforms and managed services to tackle some of the most difficult challenges in financial markets. We help our customers better understand complicated markets, reduce risk, operate more efficiently and comply with financial regulation.
This article was published by S&P Global Market Intelligence and not by S&P Global Ratings, which is a separately managed division of S&P Global.
{"items" : [
{"name":"share","enabled":true,"desc":"<strong>Share</strong>","mobdesc":"Share","options":[ {"name":"facebook","url":"https://www.facebook.com/sharer.php?u=http%3a%2f%2fwww.spglobal.com%2fmarketintelligence%2fen%2fmi%2fresearch-analysis%2fcorporate-bond-market-tradable-index-ecosystem.html","enabled":true},{"name":"twitter","url":"https://twitter.com/intent/tweet?url=http%3a%2f%2fwww.spglobal.com%2fmarketintelligence%2fen%2fmi%2fresearch-analysis%2fcorporate-bond-market-tradable-index-ecosystem.html&text=Corporate+Bond+Market+Tradable+Index+Ecosystem+%7c+S%26P+Global+","enabled":true},{"name":"linkedin","url":"https://www.linkedin.com/sharing/share-offsite/?url=http%3a%2f%2fwww.spglobal.com%2fmarketintelligence%2fen%2fmi%2fresearch-analysis%2fcorporate-bond-market-tradable-index-ecosystem.html","enabled":true},{"name":"email","url":"?subject=Corporate Bond Market Tradable Index Ecosystem | S&P Global &body=http%3a%2f%2fwww.spglobal.com%2fmarketintelligence%2fen%2fmi%2fresearch-analysis%2fcorporate-bond-market-tradable-index-ecosystem.html","enabled":true},{"name":"whatsapp","url":"https://api.whatsapp.com/send?text=Corporate+Bond+Market+Tradable+Index+Ecosystem+%7c+S%26P+Global+ http%3a%2f%2fwww.spglobal.com%2fmarketintelligence%2fen%2fmi%2fresearch-analysis%2fcorporate-bond-market-tradable-index-ecosystem.html","enabled":true}]}, {"name":"rtt","enabled":true,"mobdesc":"Top"}
]}


