Featured Topics
Featured Products
Events
S&P Global Offerings
Featured Topics
Featured Products
Events
S&P Global Offerings
Featured Topics
Featured Products
Events
S&P Global Offerings
Featured Topics
Featured Products
Events
Financial and Market intelligence
Fundamental & Alternative Datasets
Government & Defense
Banking & Capital Markets
Economy & Finance
Energy Transition & Sustainability
Technology & Innovation
Podcasts & Newsletters
Financial and Market intelligence
Fundamental & Alternative Datasets
Government & Defense
Banking & Capital Markets
Economy & Finance
Energy Transition & Sustainability
Technology & Innovation
Podcasts & Newsletters
ECONOMICS COMMENTARY — Sep 18, 2024
Download Full Report in Chinese (中文)
Comparisons between two PMI surveys for mainland China - one published by the National Bureau of Statistics of China (NBS) and the other by Caixin, compiled by S&P Global Market Intelligence - have often been made, especially during times when the figures diverge in short-term trends. Here we explore the most recent divergence for the manufacturing gauges in more detail, and draw the conclusion that both surveys are in fact sending similar signals on the health of the manufacturing economy in mainland China. While the Caixin PMI is slightly more aligned with official data over the year-to-date in terms of the production trend on average, it overstated growth late in the second quarter such that the NBS survey sent an earlier signal of a slowing manufacturing economy.
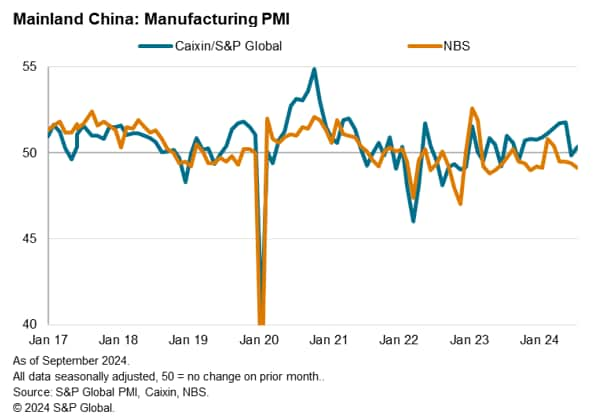
A gap has developed between the two manufacturing PMI surveys published in mainland China. The PMI survey compiled by the National Bureau of Statistics (NBS) has recorded lower readings than the PMI compiled by S&P Global Market Intelligence on behalf of Caixin. The NBS PMI has averaged 49.6 in the year to August compared with an average reading of 51.0 for the Caixin PMI.
Variations between the two surveys are by no means unusual, and in index points-terms the recent divergence is modest. Recent coverage in the markets and media of the two PMIs and their divergence is due to the diffusion index methodology used by the PMI surveys, whereby readings of 50 signify no change in business conditions. Hence, being marginally below 50.0, the NBS survey has been signaling modestly deteriorating manufacturing business conditions on average so far this year whereas, being slightly above 50.0, the Caixin PMI has been signaling modestly improving business conditions.
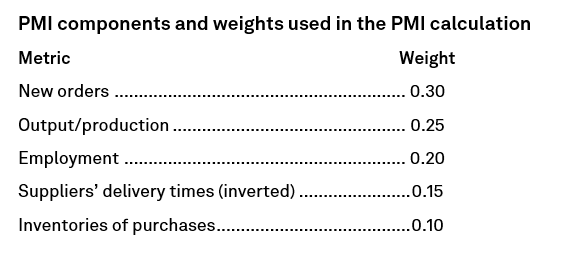
To understand more of this difference, we need to investigate the detail of the headline PMIs. These indicators are calculated from the weighted average of five individual survey indices, each of which is based on a question asking companies whether a given metric has risen/improved, fallen/deteriorated, or remained unchanged on the prior month. The variables with the greatest propensity to lead the business cycle are accorded the highest weight. Hence new orders carry the highest weight and inventories carry the lowest weight. The weights are the same for both the NBS and the Caixin PMI.
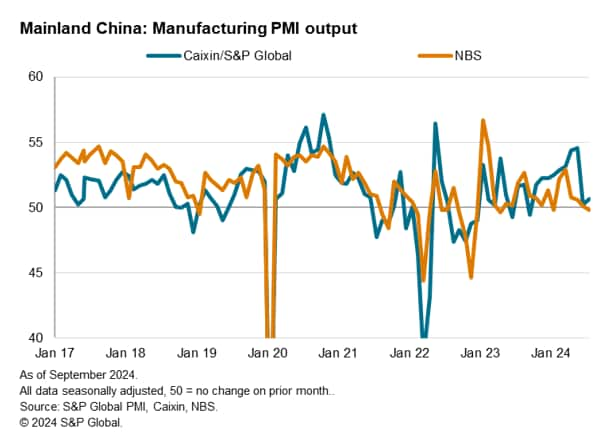
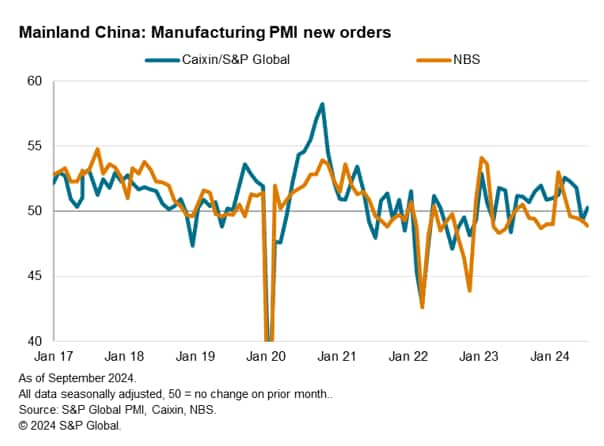
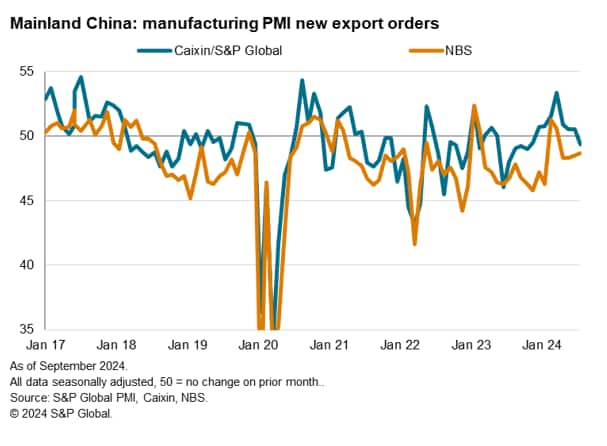
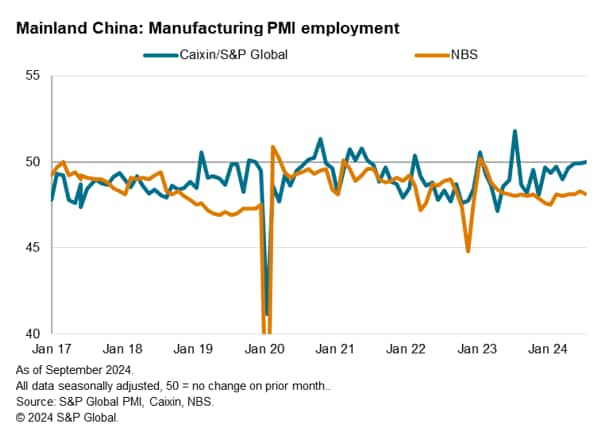
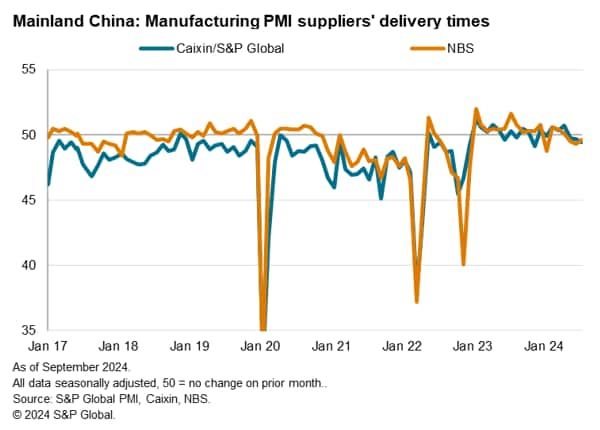
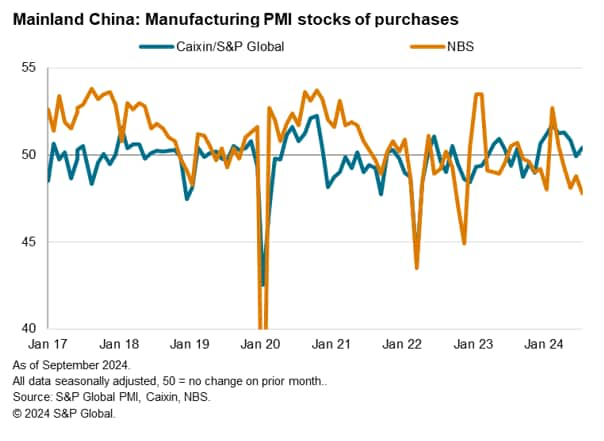
These PMI components from the two surveys are charted in the appendix, but recent trends can be summarized as follows:
In short, the Caixin PMI has been elevated relative to the NBS PMI so far this year due to its signals of stronger new orders (notably exports), production, employment and inventories.
To assess the significance of these divergences it is important to compare the PMI data with comparable official economic data, where available. This comparison requires the conversion of the PMI diffusion indices into comparable measures of official growth. This is achieved using OLS regression analysis, where the PMI index acts as the sole determinant of changes in the official rate of change in the variable being modelled.
The results of these regression analyses therefore provide clear and objective comparisons of the implied rates of change from the PMI surveys for official data where available.
In the case of mainland China, only official production data are available for comparison, and even here the official data are only available since 2018. Broader industrial production data are available, but this broader gauge is not directly comparable with the PMI manufacturing output index as it includes extractive industries such as mining and quarrying. Note also that, whereas the PMI measures month-on-month changes, we are limited to official data being available only on a year-on-year basis.
While official export data are also available, the PMI surveys measure these in volume terms whereas the official data record exports in value terms. Official, higher-frequency manufacturing employment data are no longer available, nor are data on new orders, inventories or supplier performance.
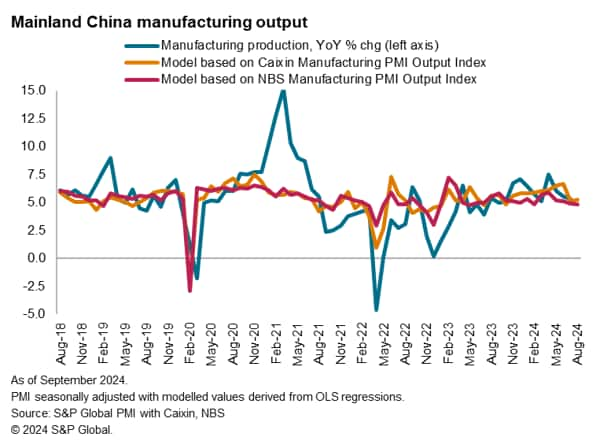
In the case of manufacturing production, the regressions from data over the past six years indicate that:
The official production data have meanwhile so far shown a 5.9% average year-on-year rate of change in manufacturing production in the first seven months of 2024, with August data not yet available. That represents an improvement on the 5.3% rate signaled on average over the whole of 2023.
Thus, while both PMIs have been signaling similar robust rates of steady growth so far in 2024, the Caixin PMI is more in line with the official average growth rate according to the regression analyses, and has also been more in line with the official data showing the average year-on-year pace of expansion to have improved slightly in 2024 so far compared to the average seen in 2023.
That said, the Caixin PMI data were notably stronger than the NBS PMI and the official manufacturing data in June, hence being late in pointing to a slowdown in the rate of expansion.
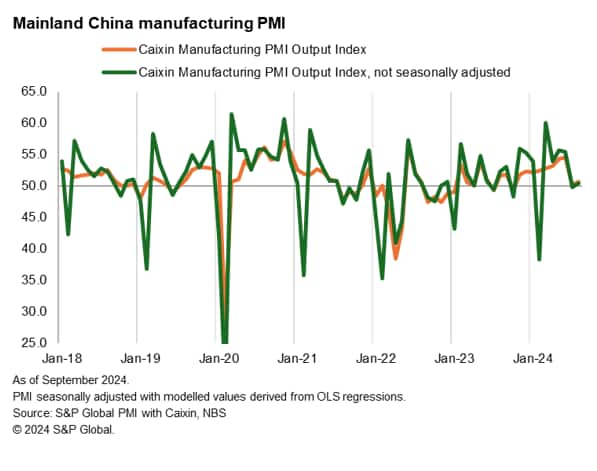
There may be several reasons for the PMI surveys to diverge, some of which are listed below:
Chris Williamson, Chief Business Economist, S&P Global Market Intelligence
© 2024, S&P Global. All rights reserved. Reproduction in whole or in part without permission is prohibited.
Purchasing Managers' Index™ (PMI®) data are compiled by S&P Global for more than 40 economies worldwide. The monthly data are derived from surveys of senior executives at private sector companies, and are available only via subscription. The PMI dataset features a headline number, which indicates the overall health of an economy, and sub-indices, which provide insights into other key economic drivers such as GDP, inflation, exports, capacity utilization, employment and inventories. The PMI data are used by financial and corporate professionals to better understand where economies and markets are headed, and to uncover opportunities.
This article was published by S&P Global Market Intelligence and not by S&P Global Ratings, which is a separately managed division of S&P Global.
