Customer Logins
Obtain the data you need to make the most informed decisions by accessing our extensive portfolio of information, analytics, and expertise. Sign in to the product or service center of your choice.
Customer Logins
ECONOMICS COMMENTARY
Oct 08, 2018
China PMI data points to resilient growth, but also highlight risks to future expansion
- Caixin Composite PMI Output Index signals modest expansion in September
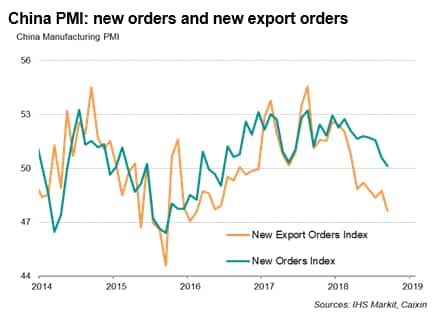
- Exports fall at fastest rate in two-and-a-half years
- PMI correlates closer with nominal than real GDP
The Chinese economy continued to enjoy resilient growth at the end of the third quarter despite increasing signs of weakening exports. However, other survey indicators point to a sombre outlook in coming months amid rising concerns over trade wars.
Softer third quarter
The Caixin China Composite PMI™ Output Index (which covers both manufacturing and services) rose marginally from 52.0 in August to 52.1 in September but remained below the historical average. At 52.1, the third quarter average signalled the weakest quarterly performance so far this year, indicating a modest slowing in the pace of economic growth.
The survey also recorded softer client demand in the three months ending September. Despite picking up very marginally in September, order book growth across both manufacturing and services in the third quarter was the lowest since the middle of 2016, with near-stagnant demand seen for manufactured products. Longer-term prospects also hinted at challenges ahead. While expectations of output in the year ahead were positive, as optimists continued to exceed pessimists, the September reading was among the lowest seen over the past three years, which suggests that output growth is unlikely to pick up in coming months.

Export woes
A further decline in exports meanwhile weighed on manufacturing activity amid escalating trade frictions. Factory output grew at the slowest rate for nearly a year in September, responding to a broad stagnation of new orders. Foreign sales fell at the quickest rate since early 2016, with anecdotal evidence pointing towards trade wars and tariffs as key reasons.


Nominal v real GDP
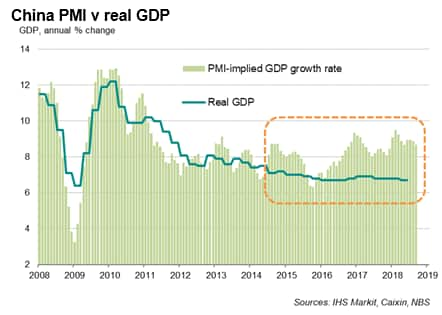
The PMI readings have been tracking real GDP closely up till the end of 2014. Since 2015, PMI readings and real GDP annual growth rates appear to have diverged, though this may be due to the deflators used in the official data.
While the official data indicate a very gradual and smooth slowing in the pace of economic activity in recent years, the PMI data have indicated a somewhat more volatile picture and have suggested stronger growth than the official numbers since last year.
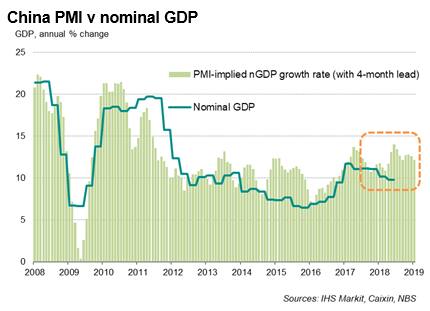
PMI surveys have a solid reputation of signalled turning points in the business cycle well in advance of official data. Compared to real GDP numbers, nominal GDP growth rates are also better at capturing the cyclical swings in the economy. As such, a comparison between PMI data and nominal GDP, over the period of 2006-2017, yields a high correlation of 83% when the PMI acts with a four-month lead over nominal GDP growth.
The latest PMI data continue to signal higher nominal growth rates than the official GDP data in the second half of 2018, which perhaps helps explain why policymakers are refraining from a massive stimulus push to support the economy amid rising threats to growth, not least from global trade tensions. Instead, the Chinese government prefers to focus on alleviating cash flow constraints and funding difficulties for firms, by reducing taxes and fees. China's finance minister Liu Kun recently announced a total tax cut this year worth over 1.3 trillion yuan (approx. USD 190 billion).
Bernard Aw, Principal Economist, IHS Markit
Tel: +65 6922 4226
bernard.aw@ihsmarkit.com
© 2018, IHS Markit Inc. All rights reserved. Reproduction in
whole or in part without permission is prohibited.
Purchasing Managers' Index™ (PMI™) data are compiled by IHS Markit for more than 40 economies worldwide. The monthly data are derived from surveys of senior executives at private sector companies, and are available only via subscription. The PMI dataset features a headline number, which indicates the overall health of an economy, and sub-indices, which provide insights into other key economic drivers such as GDP, inflation, exports, capacity utilization, employment and inventories. The PMI data are used by financial and corporate professionals to better understand where economies and markets are headed, and to uncover opportunities.
This article was published by S&P Global Market Intelligence and not by S&P Global Ratings, which is a separately managed division of S&P Global.
{"items" : [
{"name":"share","enabled":true,"desc":"<strong>Share</strong>","mobdesc":"Share","options":[ {"name":"facebook","url":"https://www.facebook.com/sharer.php?u=http%3a%2f%2fwww.spglobal.com%2fmarketintelligence%2fen%2fmi%2fresearch-analysis%2fchina-pmi-data-points-to-resilient-growth-081018.html","enabled":true},{"name":"twitter","url":"https://twitter.com/intent/tweet?url=http%3a%2f%2fwww.spglobal.com%2fmarketintelligence%2fen%2fmi%2fresearch-analysis%2fchina-pmi-data-points-to-resilient-growth-081018.html&text=China+PMI+data+points+to+resilient+growth%2c+but+also+highlight+risks+to+future+expansion+%7c+S%26P+Global+","enabled":true},{"name":"linkedin","url":"https://www.linkedin.com/sharing/share-offsite/?url=http%3a%2f%2fwww.spglobal.com%2fmarketintelligence%2fen%2fmi%2fresearch-analysis%2fchina-pmi-data-points-to-resilient-growth-081018.html","enabled":true},{"name":"email","url":"?subject=China PMI data points to resilient growth, but also highlight risks to future expansion | S&P Global &body=http%3a%2f%2fwww.spglobal.com%2fmarketintelligence%2fen%2fmi%2fresearch-analysis%2fchina-pmi-data-points-to-resilient-growth-081018.html","enabled":true},{"name":"whatsapp","url":"https://api.whatsapp.com/send?text=China+PMI+data+points+to+resilient+growth%2c+but+also+highlight+risks+to+future+expansion+%7c+S%26P+Global+ http%3a%2f%2fwww.spglobal.com%2fmarketintelligence%2fen%2fmi%2fresearch-analysis%2fchina-pmi-data-points-to-resilient-growth-081018.html","enabled":true}]}, {"name":"rtt","enabled":true,"mobdesc":"Top"}
]}


