Featured Topics
Featured Products
Events
S&P Global Offerings
Featured Topics
Featured Products
Events
S&P Global Offerings
Featured Topics
Featured Products
Events
S&P Global Offerings
Featured Topics
Featured Products
Events
Financial and Market intelligence
Fundamental & Alternative Datasets
Government & Defense
Banking & Capital Markets
Economy & Finance
Energy Transition & Sustainability
Technology & Innovation
Podcasts & Newsletters
Financial and Market intelligence
Fundamental & Alternative Datasets
Government & Defense
Banking & Capital Markets
Economy & Finance
Energy Transition & Sustainability
Technology & Innovation
Podcasts & Newsletters
ARTICLES & REPORTS — May 24, 2023
by Aditya Pandit, Data Analytics Director, Financial Risk Analytics
Credit valuation adjustment (CVA) risk is interpreted as potential mark-to-market losses that a bank would likely face due to the credit worthiness of a counterparty being affected negatively. Banks incurred a lot of CVA losses during the global financial crisis (GFC) of 2007-2008. Post GFC, there have been a lot of regulatory improvements, primarily driven by the Basel Committee on Banking Supervision (BCBS) as part of BASEL III standards to improve and strengthen the regulation and risk practices within banks. One of the elements of the BASEL III standards is the CVA risk framework for calculating the capital required to cover CVA risk.
BCBS revised the CVA risk framework in 2017 to align it more closely with the equivalent market risk framework that was first published in 2016. Further targeted revisions were proposed in November 2019 and finalized in July 2020. The targeted date for the revised standard to come into effect was 1 January 2023; however, due to the pandemic, the implementation had been pushed back by the local regulators yet again. The proposed date set by the European Banking Authority (EBA) for implementation within the EU is 1 January 2025
The CVA risk framework introduces two approaches for calculating CVA capital: the basic approach (BA-CVA) and the standardized approach (SA-CVA). BA-CVA is similar to the current standard approach; it is more conservative and coarser but easier to implement. SA-CVA is a sensitivities-based approach and is more sensitive to market movements; however, it is not that easy to implement and requires supervisory approval. This article will not go through all the details of these calculations, instead it will focus on the nuances and challenging aspects of how hedging the CVA risk is treated in SA-CVA. See MAR50-Credit valuation adjustment framework for details of the regulations.
Hedging provisions in SA-CVA
The SA-CVA approach recognizes the effect of hedging in reducing CVA risk. Eligible hedges can include:
In practice, hedging on a CVA desk depends on a lot of factors, including the mandate of the desk, availability, and the cost of hedging instruments. Hence, most of the time the hedges that the desk may put on might be imperfect. For example, only the 5Y CDS might be liquid enough to hedge a single name across all tenors, or the desk might choose to hedge the CCS risk using an index across multiple names as the market for single names is quite illiquid. The desk might also choose to look at the entire XVA risk to hedge instead of just CVA risk. As we discuss in this article, the dynamics and practical choices made by the XVA desk can result in an ineffective hedging strategy for SA-CVA.
Hedging with the same risk factor
For SA-CVA, the optimal way to hedge is to put on a hedge for the same risk factor. This reduces the net-weighted sensitivity of the CVA portfolio to the risk factor WSk . (MAR 50.52)

The resultant net-weighted sensitivity WSk is used in the SA-CVA aggregation.
The following plots illustrate the effects of hedging in various scenarios. Unless stated, the capital is calculated for a unit of CVA sensitivity, for a particular risk factor k against the hedge coverage. A unit of hedge coverage for a risk factor k implies that the hedge sensitivity is equal in magnitude but opposite in sign to the CVA sensitivity for the same risk factor. For a perfect hedge, the net-weighted sensitivity is zero.

Plot 1 shows the impact on capital when hedged with the same risk factor. The capital is lowest when the hedge coverage is 1, which in theory should result in a perfect hedge. However, to prevent the possibility of recognizing perfect hedging, SA-CVA has a concept of hedging disallowance parameter R, which is set to 0.01 (MAR50.52(1)). This plot also shows the hedge coverage going above 1 to illustrate that over hedging can lead to an increase in CVA capital, demonstrating that there are no provisions in SA-CVA to recognize the optimal hedge.
Hedging with eligible hedges within the same bucket
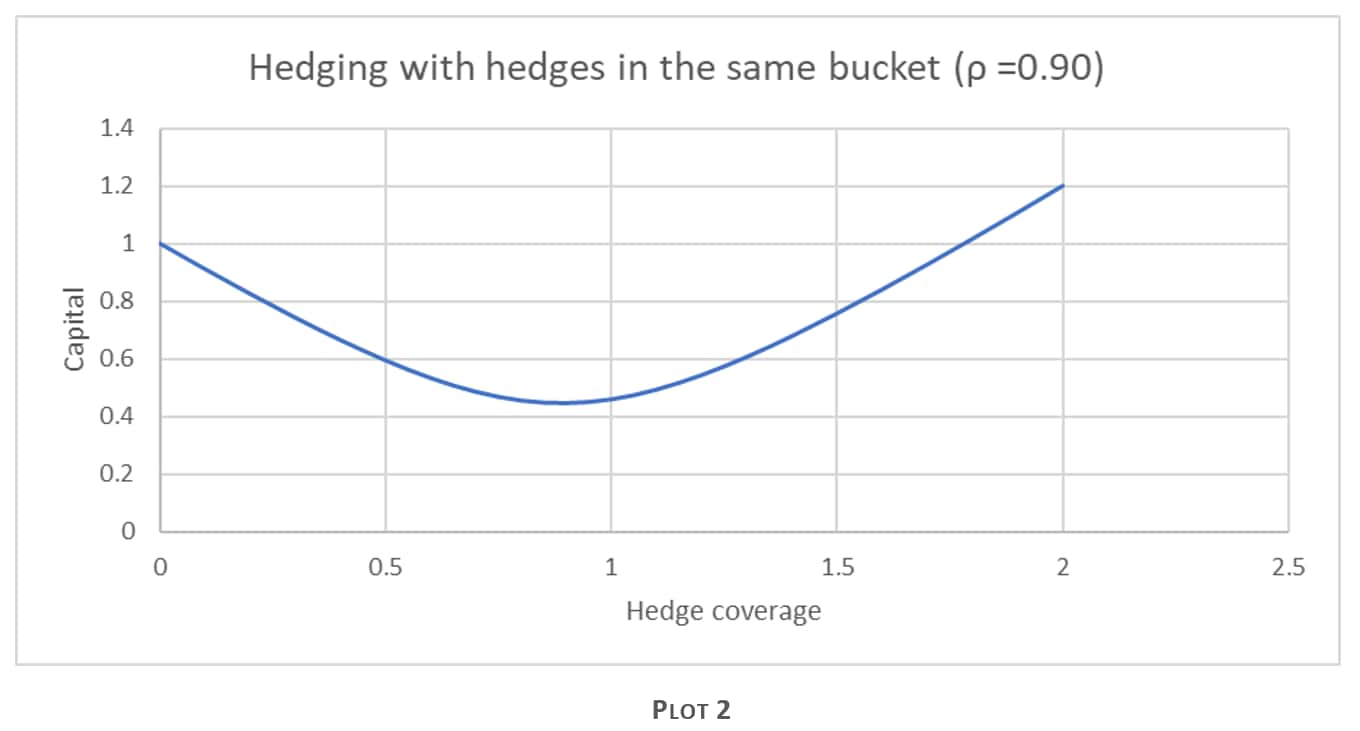
The desk will put on the hedges depending on various factors as stated above and in turn a lot of hedges will be imperfect, thus introducing basis risk. SA-CVA captures this with the intra-bucket correlation parameter ρkl, a regulatory-defined calibrated parameter between individual risk factors of the same bucket. Plot 2 highlights the impact of the capital when CCS risk is being hedged with a single-name CDS and there is tenor basis risk involved. The plot shows that due to the introduction of this correlation parameter, the optimal hedge is not when hedge coverage is 100%. The reduction of capital is also less than hedging with the same risk factor, as one would expect.

Hedging with index hedges
The impact on SA-CVA due to hedging with index hedges is a complex one. With the latest revisions to the SA-CVA regulations, the regulator has introduced different buckets for qualified indices and modified the aggregation formula to recognize them. However, the effectiveness of these hedges is quite different from bucket to bucket.
MAR 50.49 requires banks to recalculate the index sensitivity by applying the shift to all the index constituents and recalculating the changed value of the index. The bank, per MAR 50.50, can then introduce a set of additional risk factors that directly correspond to qualified credit or equity index. Per this rule, for a covered transaction or a hedge whose underlying is a qualified index, the contribution to the index constituents is replaced with its contribution to a single sensitivity to the underlying index. SA-CVA has new buckets for qualified indices in the following risk classes:
According to MAR50.50, if 75% of the constituents of a qualified index are mapped to the same sector, the entire index is mapped to the same sector and treated as a single-name sensitivity in that bucket. This means that banks can decompose the index, calculate the risk to the constituents, and assign it to the relevant buckets. Alternatively, for a qualified index, the bank can add new index-specific risk factors and, depending on the index, can either assign it to a relevant bucket based on the 75% rule or assign it to Bucket 8 ("Qualified Indices").
Let's look at the hedge effectiveness of a qualified index hedge in two cases using the CCS risk class.
Case 1: Assigning an index to a specific bucket
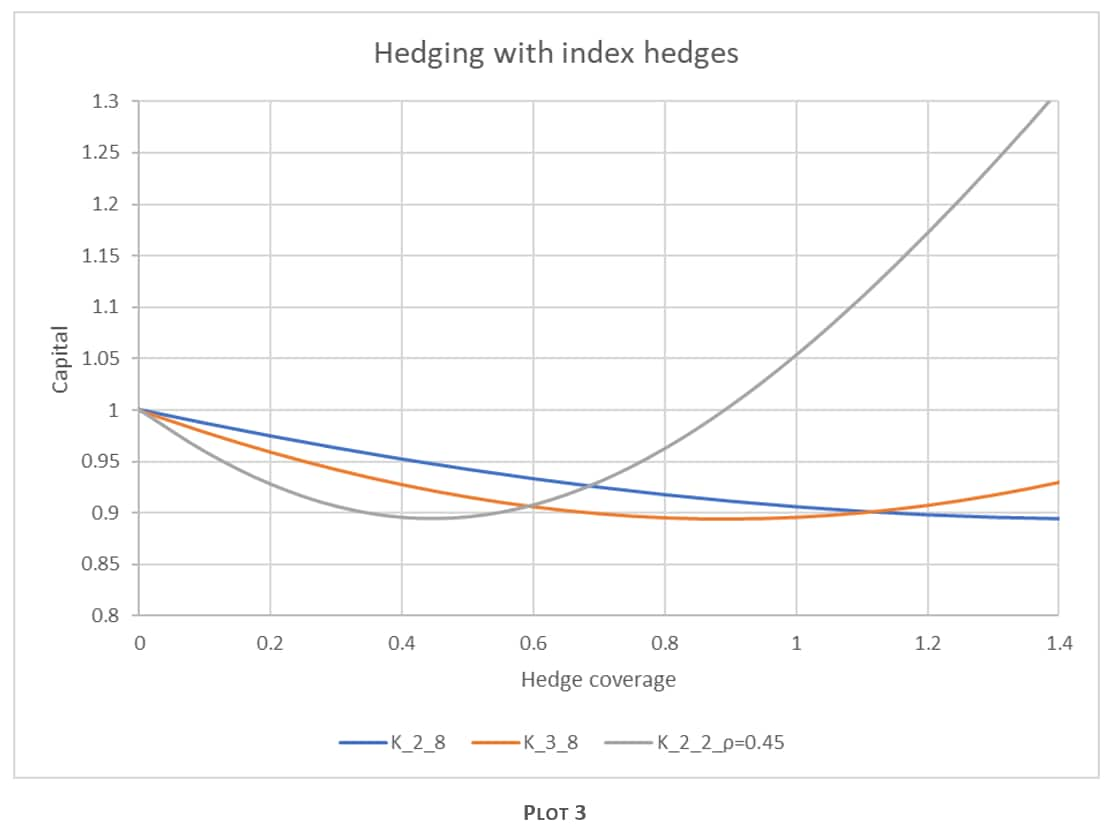
In the first case, the bank puts in a qualified index hedge whose constituents are predominantly in financials. The index is mapped to Bucket 2. There is tenor basis risk and no legal relation between the qualified index and the other names in the bucket, so the intra-bucket correlation parameter is set to ρkl = 0.45. (ρtenor=0.9 and ρname=0.5). Plot 3 shows the impact of putting such a hedge on SA-CVA. K_2_2_ρ=0.45 indicates that both the CVA risk and the hedge are in bucket 2. In this specific case hedging with hedge coverage equal to 1 will contribute to increasing the capital!
Case 2: Hedges in the qualified index bucket
The impact on the capital when a qualified index hedge is applied can be seen in Plot 3. It shows the impact on capital for a unit CVA sensitivity in a specific bucket (Buckets 2 and 3 in this case) to the hedge that is in Bucket 8. The impact on the capital and the effectiveness of the hedge depends on the bucket, which in turn depends on the risk weight of each bucket. From the plot above it is easy to see that applying a qualified index hedge across a wide variety of counterparties across buckets does not necessarily decrease the SA-CVA capital much.

Industry response to the proposed revisions
Some of the issues discussed in this article were raised by the International Swaps and Derivatives Association (ISDA), the Global Financial Markets Association (GFMA), and the institute of International Finance (IIF) in response to the revisions proposed by the BCBS and are summarized as follows:
The ISDA and the Association for Financial Markets in Europe (AFME) also issued a response to the Prudential Regulation Authority (PRA) implementation of Basel 3.1 with two recommendations for improving the recognition of index hedges by:
Hedging CVA risk versus XVA risk
Depending on the desk mandate, an XVA desk might put on a market risk hedge for net XVA risk as opposed to only CVA risk. This could include hedging funding valuation adjustments such as funding valuation adjustment (FVA) and collateral valuation adjustment (COLVA). MAR50.37 requires that only whole transactions used for the purpose of mitigating CVA risk, and managed as such, can be eligible hedges. Transactions cannot be split into several effective transactions. This wording does not give banks the ability to split an XVA hedge so that only the CVA risk can be allocated to the SA-CVA calculation. This means that the desks have to put on specific hedges for CVA risk as opposed to the net XVA risk. While some regulators recognize FVA/COLVA hedges as being exempt from the market risk capital calculations, others do not, so FVA hedges could then be treated as naked positions, which will have an adverse impact on SA-CVA capital.
Conclusion
In this article, we discussed some of the salient points of hedging as it pertains to SA-CVA. We conclude with the points that reducing the risk on the desk might not optimize SA-CVA capital, and that the industry is still pushing the regulator for better recognition of index hedges. It will be interesting to see if there are further updates to the regulation before the implementation start date.
Learn more about the XVA solution from S&P Global Market intelligence.
S&P Global provides industry-leading data, software and technology platforms and managed services to tackle some of the most difficult challenges in financial markets. We help our customers better understand complicated markets, reduce risk, operate more efficiently and comply with financial regulation.
This article was published by S&P Global Market Intelligence and not by S&P Global Ratings, which is a separately managed division of S&P Global.
Location
