Customer Logins
Obtain the data you need to make the most informed decisions by accessing our extensive portfolio of information, analytics, and expertise. Sign in to the product or service center of your choice.
Customer Logins
CREDIT COMMENTARY
Aug 24, 2018
CDS in Buy-side Risk Management
Is the credit cycle at a late stage? There are good reasons to think that it is. If so, investment firms should look to use CDS and derived datasets as a risk management input for both cash and synthetic credit exposure
A mature credit cycle
Last year a well-known asset management firm stated that the global economic outlook was "as good as it gets". Their optimism was understandable, but events in 2018 - the advent of a possible trade war, tighter monetary policy, the election of a populist Italian government, Turkey's ongoing turmoil, to name but a few - have caused even the most bullish of investors to reconsider their views.
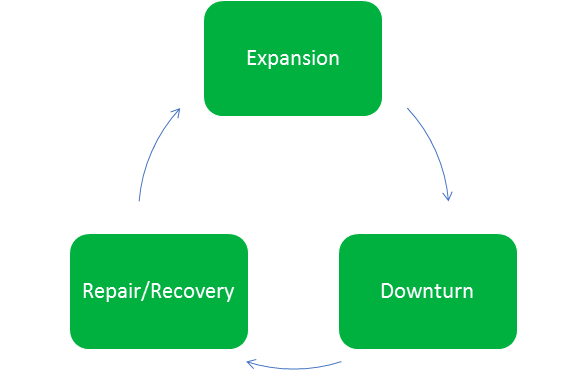
Economic cycles are not the same as corporate credit cycles, though they are inextricably linked. The credit cycle is a pattern of the relative availability and use of credit over a period of time and is typically defined as a three-stage process: (i) repair/recovery; (ii) expansion; and (iii) downturn. Determining which stage an economy resides in is not an exact science - like much of economics. But there is one feature of the current cycle that cannot be disputed: it is one of the longest on record.

Is the downturn imminent?
We can safely state that the US is currently in the expansion phase and has been for several years. It began in the aftermath of the Great Financial Crisis (most estimate the start to be 2012), and it was the nature of the repair and recovery following that seismic event that helps explain the cycle's longevity. The Fed Funds rate was cut to 0.25% - a record low - and stayed at that level for seven years.
Alongside the cut in rates, the Fed introduced a massive quantitative easing programme that expanded its balance sheet and the monetary base. These extraordinary monetary policies led to a glut of liquidity and compression of bond yields, and provide a convincing explanation as to why this credit cycle is unusually long.
But it hasn't been plain sailing since the Fed eased policy. A sovereign debt/banking crisis in the eurozone in 2010-2012 threatened to send the global economy into a tailspin until the ECB made its decisive intervention. Indeed, the eurozone's banks in the periphery could still be regarded as in the repair stage of the credit cycle as they endeavour to reduce non-performing loans and clean up their balance sheets.
It should be noted that banks have had structural, as well as cyclical factors, to manage. In particular, a more stringent capital adequacy regime may have impinged their ability to provide funding (though regulators would contest this). But the excess liquidity is still finding a home though private debt markets and direct lending. Overall it seems likely that Europe is in an earlier phase of the expansion stage compared to the US.
There are several indicators that point towards the expansion stage reaching maturity. Corporate leverage is historically quite high and the second-quarter US earnings season showed S&P 500 profit margins at their highest for over 10 years. Peaking profitability is often a precursor to a recession. Lending standards are also low - witness the growth in covenant-lite loans. "Cov-lite" is now the new normal in the loan market. And, of course, monetary policy is tightening with rates on the rise in the US and UK, while the ECB's QE is scheduled to be withdrawn later in 2018.
Yet these warning signs don't necessarily presage a shift to the downturn stage of the cycle. Many of these signals were evident a year ago and President Trump's tax reforms could serve to lengthen the cycle further. Shareholder-friendly actions - another omen of late stage credit cycles - are on the rise but we are certainly not seeing a boom in LBOs a la 2005-2007. Bank balance sheets are in better shape, though the repair work was done more thoroughly in the US.
Managing Credit Risk with CDS
Judging the specific stage of the credit cycle is somewhat subjective, but it seems likely that it is well into its expansion phase, particularly in the US. Prudent asset managers are therefore using all the tools at their disposal to manage credit risk.
Credit Default Swaps are an important instrument in this process. Many investment firms have used CDS to hedge their credit exposure since the early part of this century, both from a macro perspective - through indices such as Markit iTraxx and CDX - and idiosyncratic positions with single name CDS. Given the likely stage of the cycle, it seems probable demand for protection will increase as investors hedge the inevitable credit deterioration that will ensue with a downturn.
Some buy-side institutions may only trade indices, seeking comfort in the robust liquidity that has been maintained through the various crises and to the present day. Others may be restricted to bonds, either due to preference or because their mandate precludes them from using derivatives.
Assessing credit risk data
Regardless of whether an asset manager trades CDS or not, it is regarded as a crucial component in risk management. Corporate and sovereign bonds can be decomposed into various risk factors, including interest rate, inflation and liquidity risk. In addition, there is credit risk. Like their counterparts on the sell-side, investment firms use value-at-risk (VaR) and scenario analysis. Sourcing data is a key part of ensuring accurate risk figures are produced, and risk managers will face a choice when deciding which dataset is most applicable for each risk factor.
There are several considerations when making this choice,
including:
(1) Coverage of data
(2) The amount of history - does it cover stressed periods?
(3) Quality of data
For credit risk factors, single name CDS data are often used in calculations for both cash and synthetic positions. If we take the points above in turn:
(1) Coverage - IHSM prices over 2,000 CDS entities daily, sourced from liquidity providers that warehouse risk. This is comprehensive but clearly smaller than the number of entities that issue bonds. Where CDS curves are not available on an entity, risk managers will choose a proxy, which could be an issuer yield curve or a bond sector curve. Both of these datasets are provided by IHSM and are can be valid choices.
But many buy-side firms - and risk management vendors - opt for IHSM CDS sector curves. These are calculated on a three-factor basis - sector, region and rating - using a cross-sectional model. This approach ensures regional granularity while eliminating the artificial volatility that can result from a basic intersection model. Spikes that are not reflective of underlying credit risk - a problem commonly encountered by risk managers - are avoided.
(2) History - Bonds are non-standardised instruments with irregular maturities and other terms. This makes it difficult to measure the credit risk factor, particularly over time. CDS, on the other hand, are standardised instruments with regular contractual terms as defined by ISDA. A continuous time series can be formed, with IHSM single name data going back to 2001 and sector curves to 2007. This is crucial for stressed VaR, as the time series covers the Great Financial Crisis.
(3) Quality - As well as ensuring that risk factor data have sufficient coverage and quality, risk managers should have confidence in the quality of the dataset. Stringent data quality checks should be undertaken by the vendor, including outlier, staleness and curve buildability checks. In addition to these, IHSM also provide liquidity metrics to allow institutions to assess activity in each entity.
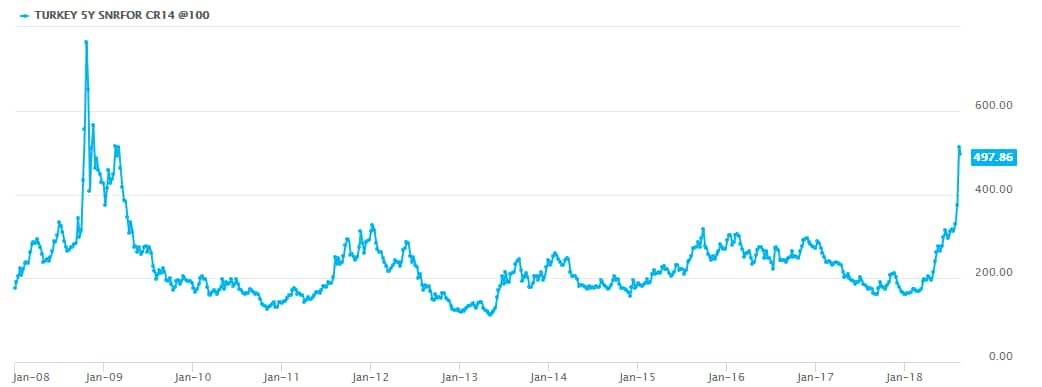
Turkey

Source: IHSM Price Viewer
A topical example that demonstrates the applicability of CDS as a credit risk factor is Turkey. The sovereign is in credit distress (its credit curve has inverted) due to concerns about government interference in monetary policy, weak fundamentals and deteriorating relations with the US. This has resulted in five-year CDS spreads widening beyond 500bps. But the length of the CDS time series - IHSM has data going back to 2001 - puts this in context over the credit cycle. At the peak of the downturn stage in 2008 Turkey's spreads were trading at almost 800bps, significantly wider than current levels. It's also important to note that Turkey is one of the most liquid names in the CDS universe with consistently high volumes and a IHSM Liquidity Score of '1' (the most liquid).
Counterparty Risk
We have seen that CDS data is central to the credit risk management process. But it is also useful in managing counterparty risk. CDS spreads respond rapidly to events compared to credit ratings, which showed during the last downturn that they lagged the turn in the cycle. Central clearing and incoming initial margin regulations will mitigate some of this risk, but there will still be numerous buy-side firms that have uncollateralised exposures. Even positions that are 100% collateralised have some residual counterparty risk. Banks have long used CDS as part of their Credit Valuation Adjustment (CVA) processes and an increasing amount of buy-side institutions now use market data in their counterparty risk management.
Is the cycle about to turn?
It is easy to find indicators that point towards the current credit cycle ending in the usual fashion - with a downturn. That doesn't mean it is imminent. This is no normal cycle and the global economy is still feeling the effects of unconventional monetary policies, as well as a pro-cyclical US fiscal policy. Nonetheless, asset managers need to have their risk factors in order and when it comes to credit and counterparty risk CDS is a crucial part of the toolkit.
S&P Global provides industry-leading data, software and technology platforms and managed services to tackle some of the most difficult challenges in financial markets. We help our customers better understand complicated markets, reduce risk, operate more efficiently and comply with financial regulation.
This article was published by S&P Global Market Intelligence and not by S&P Global Ratings, which is a separately managed division of S&P Global.
{"items" : [
{"name":"share","enabled":true,"desc":"<strong>Share</strong>","mobdesc":"Share","options":[ {"name":"facebook","url":"https://www.facebook.com/sharer.php?u=http%3a%2f%2fwww.spglobal.com%2fmarketintelligence%2fen%2fmi%2fresearch-analysis%2fcds-in-buyside-risk-management.html","enabled":true},{"name":"twitter","url":"https://twitter.com/intent/tweet?url=http%3a%2f%2fwww.spglobal.com%2fmarketintelligence%2fen%2fmi%2fresearch-analysis%2fcds-in-buyside-risk-management.html&text=CDS+in+Buy-side+Risk+Management+%7c+S%26P+Global+","enabled":true},{"name":"linkedin","url":"https://www.linkedin.com/sharing/share-offsite/?url=http%3a%2f%2fwww.spglobal.com%2fmarketintelligence%2fen%2fmi%2fresearch-analysis%2fcds-in-buyside-risk-management.html","enabled":true},{"name":"email","url":"?subject=CDS in Buy-side Risk Management | S&P Global &body=http%3a%2f%2fwww.spglobal.com%2fmarketintelligence%2fen%2fmi%2fresearch-analysis%2fcds-in-buyside-risk-management.html","enabled":true},{"name":"whatsapp","url":"https://api.whatsapp.com/send?text=CDS+in+Buy-side+Risk+Management+%7c+S%26P+Global+ http%3a%2f%2fwww.spglobal.com%2fmarketintelligence%2fen%2fmi%2fresearch-analysis%2fcds-in-buyside-risk-management.html","enabled":true}]}, {"name":"rtt","enabled":true,"mobdesc":"Top"}
]}


