Featured Topics
Featured Products
Events
S&P Global Offerings
Featured Topics
Featured Products
Events
S&P Global Offerings
Featured Topics
Featured Products
Events
S&P Global Offerings
Featured Topics
Featured Products
Events
Financial and Market intelligence
Fundamental & Alternative Datasets
Government & Defense
Banking & Capital Markets
Economy & Finance
Energy Transition & Sustainability
Technology & Innovation
Podcasts & Newsletters
Financial and Market intelligence
Fundamental & Alternative Datasets
Government & Defense
Banking & Capital Markets
Economy & Finance
Energy Transition & Sustainability
Technology & Innovation
Podcasts & Newsletters
EQUITIES COMMENTARY — Jan 29, 2021

By Sam Pierson
The January 2021 short squeeze may go down as the most significant ever, given the soaring share prices of highly shorted US equities. The performance of short interest factors - that is methods of ranking stocks by most to least shorted with the aim of going long the least-shorted and short the most-shorted - are on pace to suffer their worst month on record in January. The most heavily shorted firms, per the exchange short interest, outperformed the least shorted by 23.9% MTD through January 28th. The nearest competition for "worst month for short factors" consists of April 2009 when the most shorted outperformed +15%, and April 2020 (most shorted outperformed by +21%), per the IHS Markit Research Signals database. Ranking by the percentage of shares on loan yields a similar result for January, with most-borrowed outperforming by 23.6% MTD. Even more stark is ranking by borrow cost, where the most expensive to borrow US equities outperformed the least expensive to borrow by 29% MTD, also a record. It's worth bearing in mind the breadth of these results: Even if the heralds of the short squeeze, GameStop and AMC, were removed from the analysis, the relative outperformance of high-fee US equities would still be more than 25% for MTD January as compared with the lowest-fee shares.
Background:
From March 2008 through March 2020 the most expensive to borrow US equities (high-fee) underperformed the least expensive to borrow shares (low-fee) by an average of 1.3% per month. This has been observed in academic research as one of the most consistent quantitative investment factors in terms of raw price returns. Given the historical underperformance of high borrow fee shares, simply filtering out high-fee shares as potential long positions has been popular with some long-only active quant funds, which has had a consistently positive impact on returns since the GFC (not taking into account the foregone opportunity to lend those shares to capture the elevated fees). There have been some prior periods with relative outperformance of high-fee shares, specifically late-2013 to early-2014 and the 2nd half of 2016, however those periods were relatively brief, and the rolling 12-month average return spread was never positive for more than three months. For an active manager those periods would have introduced underperformance, for example avoiding highly shorted biotech companies in 2013 and 2014 would have resulted in lagging behind benchmark indices which had exposure. In that case, the relative underperformance of crowded biotech shorts over the 2nd half of 2015 and first half of 2016 would have suggested the avoidance of high-fee shares had been efficacious. Similarly avoiding highly shorted energy companies over the latter ¾ of 2016 would have caused a manager to lag an index with exposure, however the valuations in that cohort, largely shale-related producers, were already far below where they'd been a year prior and continued to fall thereafter. Those experiences may have suggested that high-fee shares were likely to underperform in the medium-to-long run, and that countertrends were likely to be short and were furthermore unlikely to undo more than a year's worth of underperformance before returning to the long-run trend.
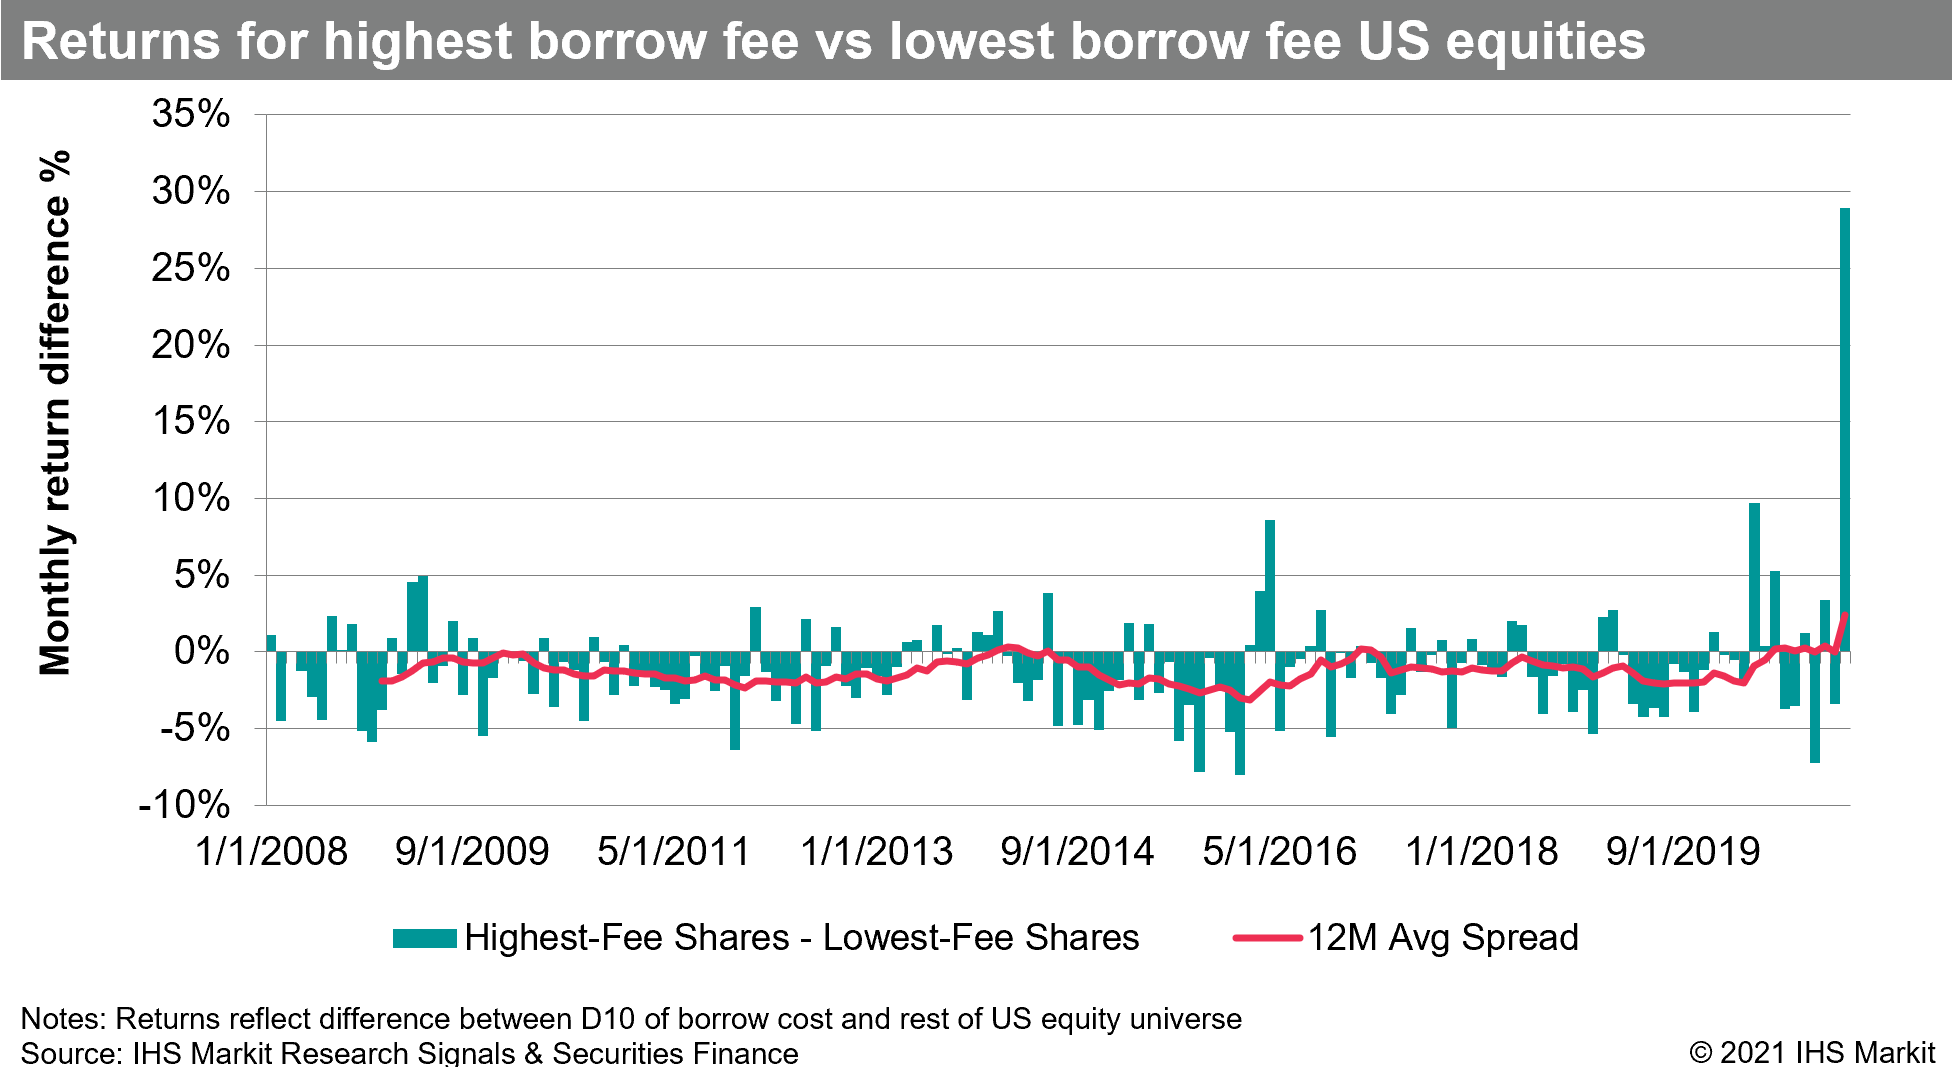
Following the substantial outperformance of high-fee shares in April and June 2020, the rolling 12m average spread between high and low fee shares turned positive and has remained there since. Including the MTD return through January 28th, the highest fee US equities have outperformed by 2.6% per month on average over the 12 months. While these shares make up a relatively small amount of most benchmark indices, the marked outperformance relative to low-fee shares may be driving relative underperformance for long-only managers who don't own them (to say nothing of the comparison to funds who also lend the shares for an additional return). This may set up an additional buyer of highly shorted shares - long-only investors who were previously underweight. Of course, the opposite side of the trade is a portrait of pain for short sellers, who are currently paying an average 11% annualized borrow fee for the most expensive to borrow shares, in addition to losses incurred by the increasing share prices. The lessons learned on the short side in 2013/4 and 2016 appeared to manifest in the market declines at the end of 2018 and in March 2020 where there was a muted reaction on the part of short sellers to the broad market decline. That was a far cry from Q1 2016, when short positioning increased dramatically in share terms amid the market decline, to the chagrin of the short sellers shortly thereafter.
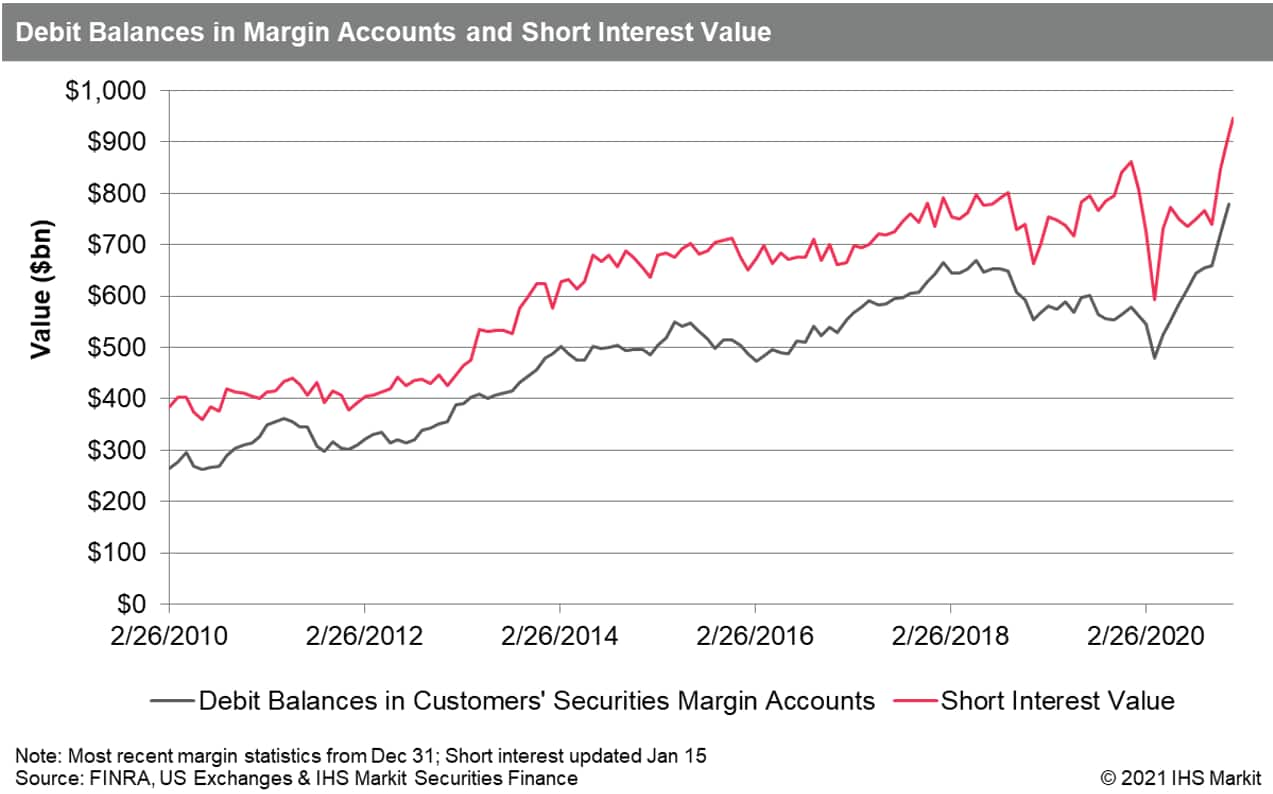
The surge in prices for highly shorted US equities in the early going of 2021 was partly set up by the 2020 year-end positioning, which saw an all-time record for debit balances in margin accounts and short interest value. The December 2020 margin statistics from FINRA shows a record for debit balances in margin accounts, $778bn. The December 31st short interest observation set a record with $915bn in short positions reported (subsequently dethroned by Jan 15th observation at $946bn). It's interesting to contrast these balances with year-end 2019, when short interest positions were valued at $860bn (then a record) while debit balances were $579bn (-13% compared with May 2018 record).
GameStop:
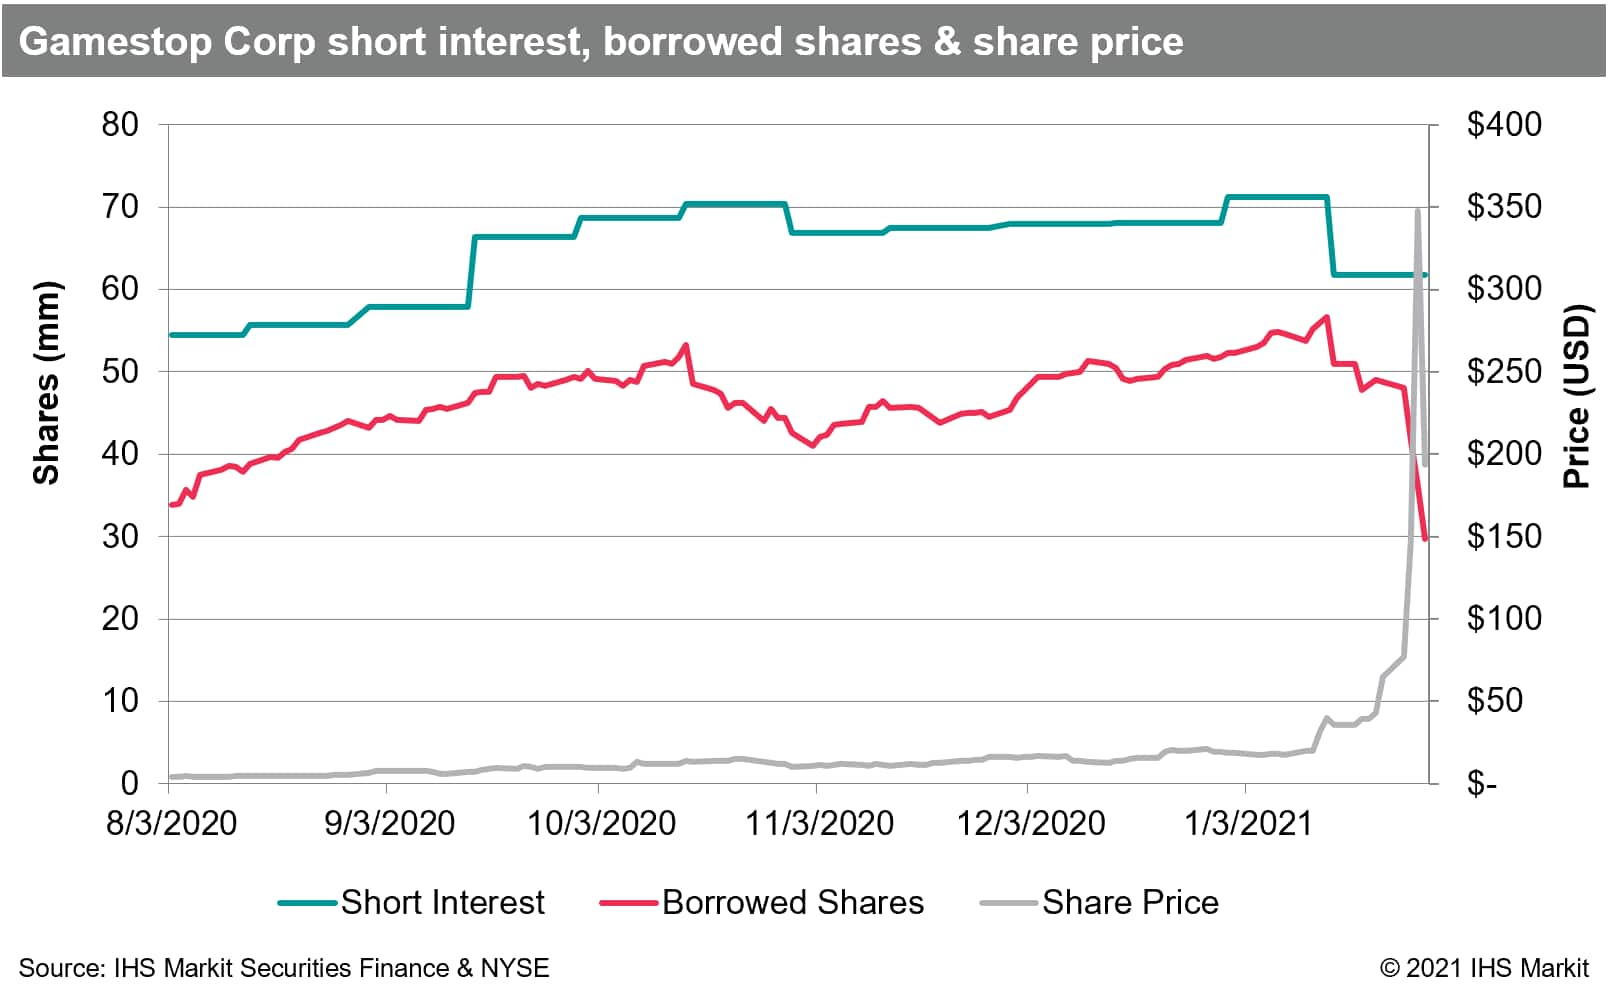
The poster child for the 2021 short squeeze is undoubtedly GameStop (GME). While the trading dynamics of the GME trade extend well beyond short positions in the common shares, a few points are worth considering on that front. Firstly, in terms of timing of information, there was a 5.6m share reduction in shares on loan tied to settling Jan 13th trading, which reflected some amount of short covering, but that the short position in share terms had only declined slightly in reaction to the single day 57% increase in the share price. The Jan 15 short interest data was published on Jan 27 and showed that the short interest had only declined by 9.4m shares as of mid-Jan, confirming the signal suggested by the share borrowing data, that the majority of the short position remained in place as of Jan 15th. The number of shares on loan declined by another 19m shares from Jan 22 - 28, suggesting that a larger portion of the short position was covered amid the surging share price during that week. It is worth pointing out that the total short interest (or shares on loan) were only a tiny fraction of the traded volume during this time, which does not preclude short covering from having had an impact at specific points in time, but the buying of shares to cover shorts can only go so far in explaining the increased share price.
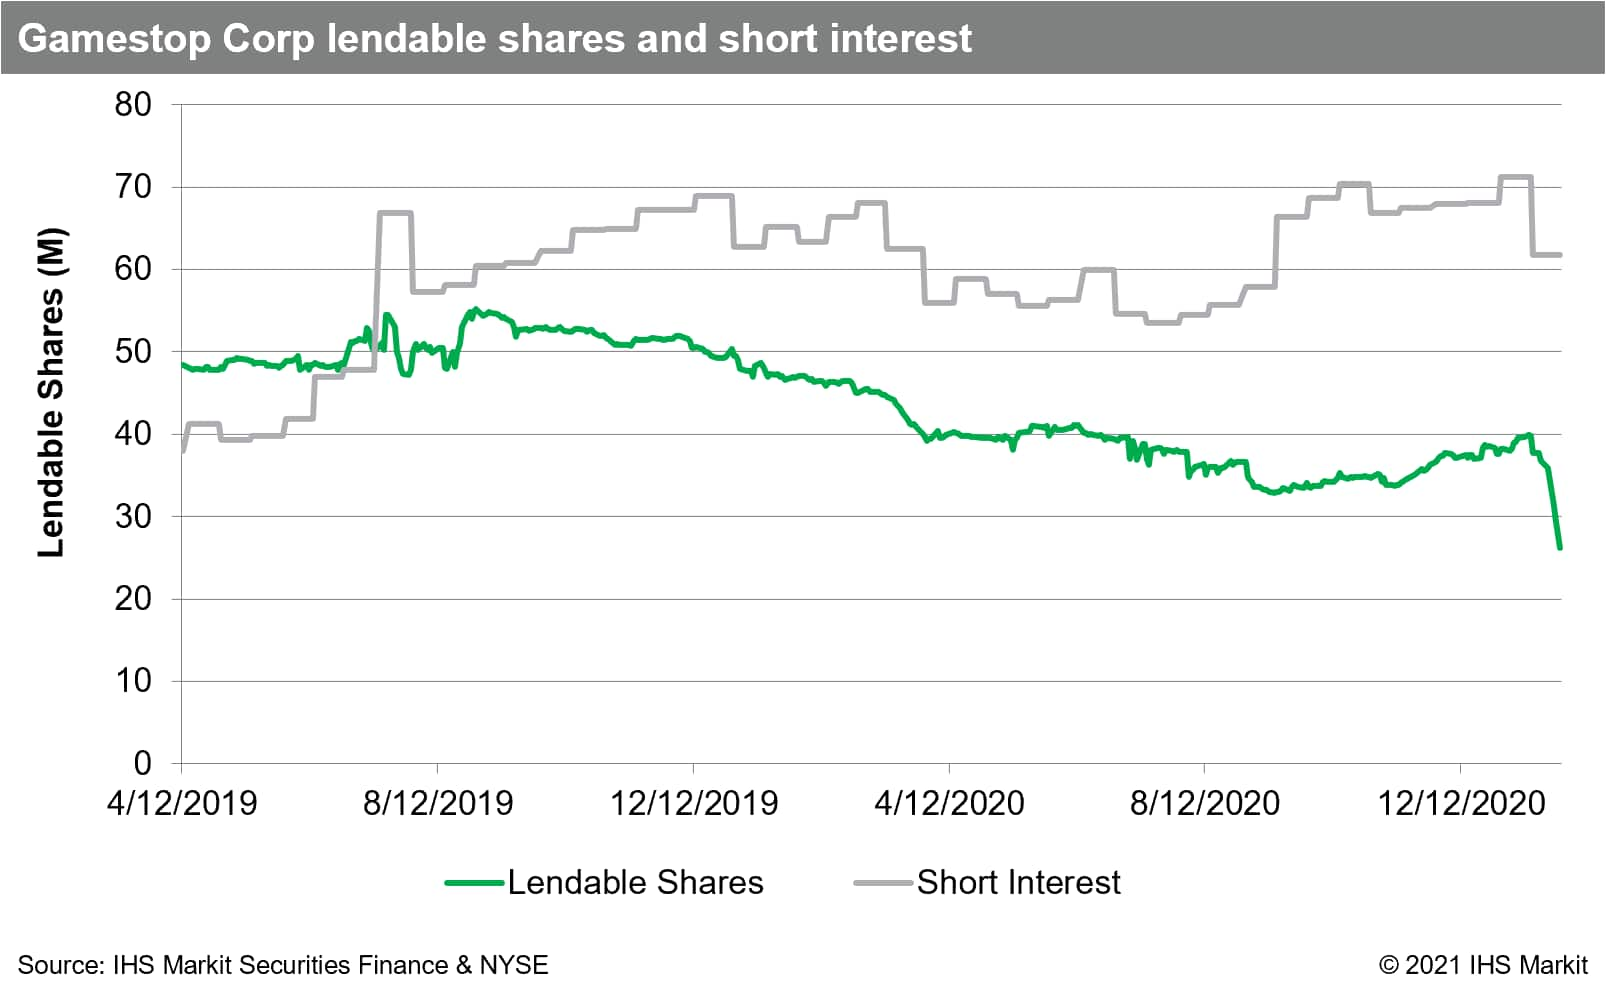
There has been substantial discussion of the GME short interest as a percentage of shares outstanding or float. On this topic it's worth remembering that shares are not consumed in the short selling process, they are sold onward to a new holder who then faces the decision to lend or not. If every holder were willing to lend 100% of their holdings, and no holders were restricted from trading or lending, then the only limit would be that the short interest couldn't increase by more than the total shares outstanding each day. It is important to realize that there is not a logical inconsistency in more than 100% of shares outstanding being short. As an example, imagine there is an investor who owns 100% of the outstanding shares of a firm and a short seller who every day borrows 100 shares and short sells them back to the long investor. Eventually the short seller will be short 100% of the shares outstanding, at which point the long investor will be long 200%. On that day the long investor would have custody of 100% of the shares and could lend some or all of them to the short seller again. In practice, many investors only make a portion of their holdings available, some don't lend at all and others own shares in margin accounts (where they may be lent depending on the usage of margin debt), so there are fewer than 100% of shares to start with and the purchaser of shares from a short seller may not lend them, both of which result in an uncertain supply of shares for short sellers to borrow. The supply of shares from beneficial owners in securities lending programs can be tracked as a real-time indication of availability from institutional owners of shares, while the gap between the exchange short interest and borrowed shares provides an indication of shares sourced by broker dealers away from the traditional securities finance channel.
AMC Holdings:
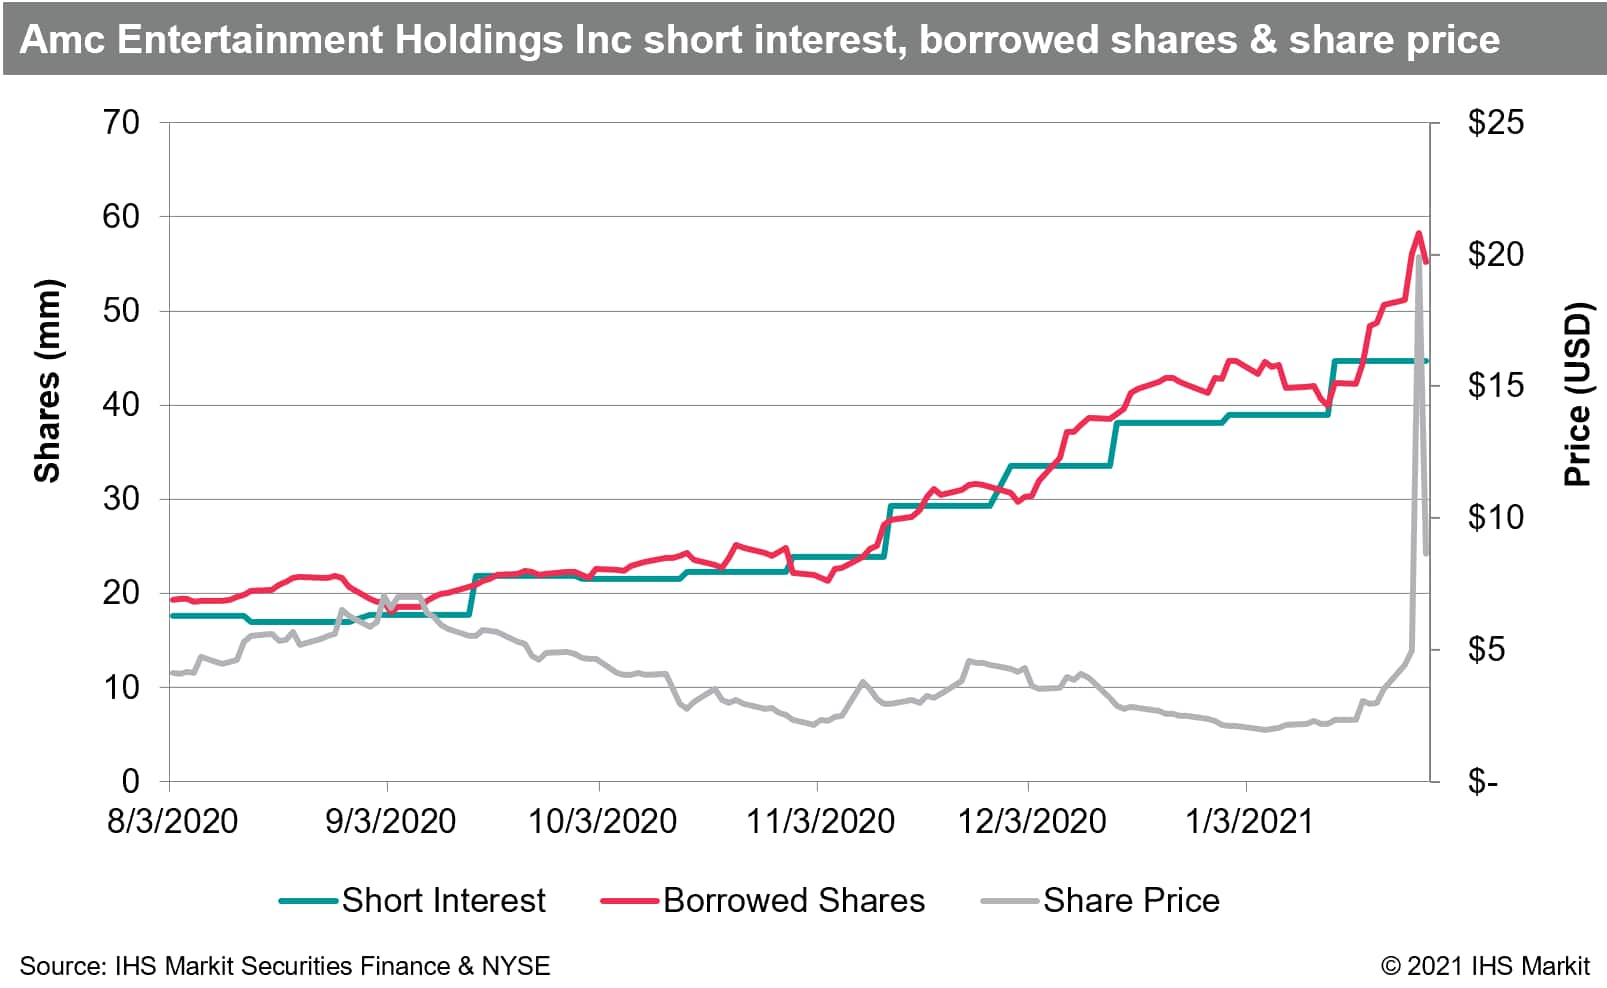
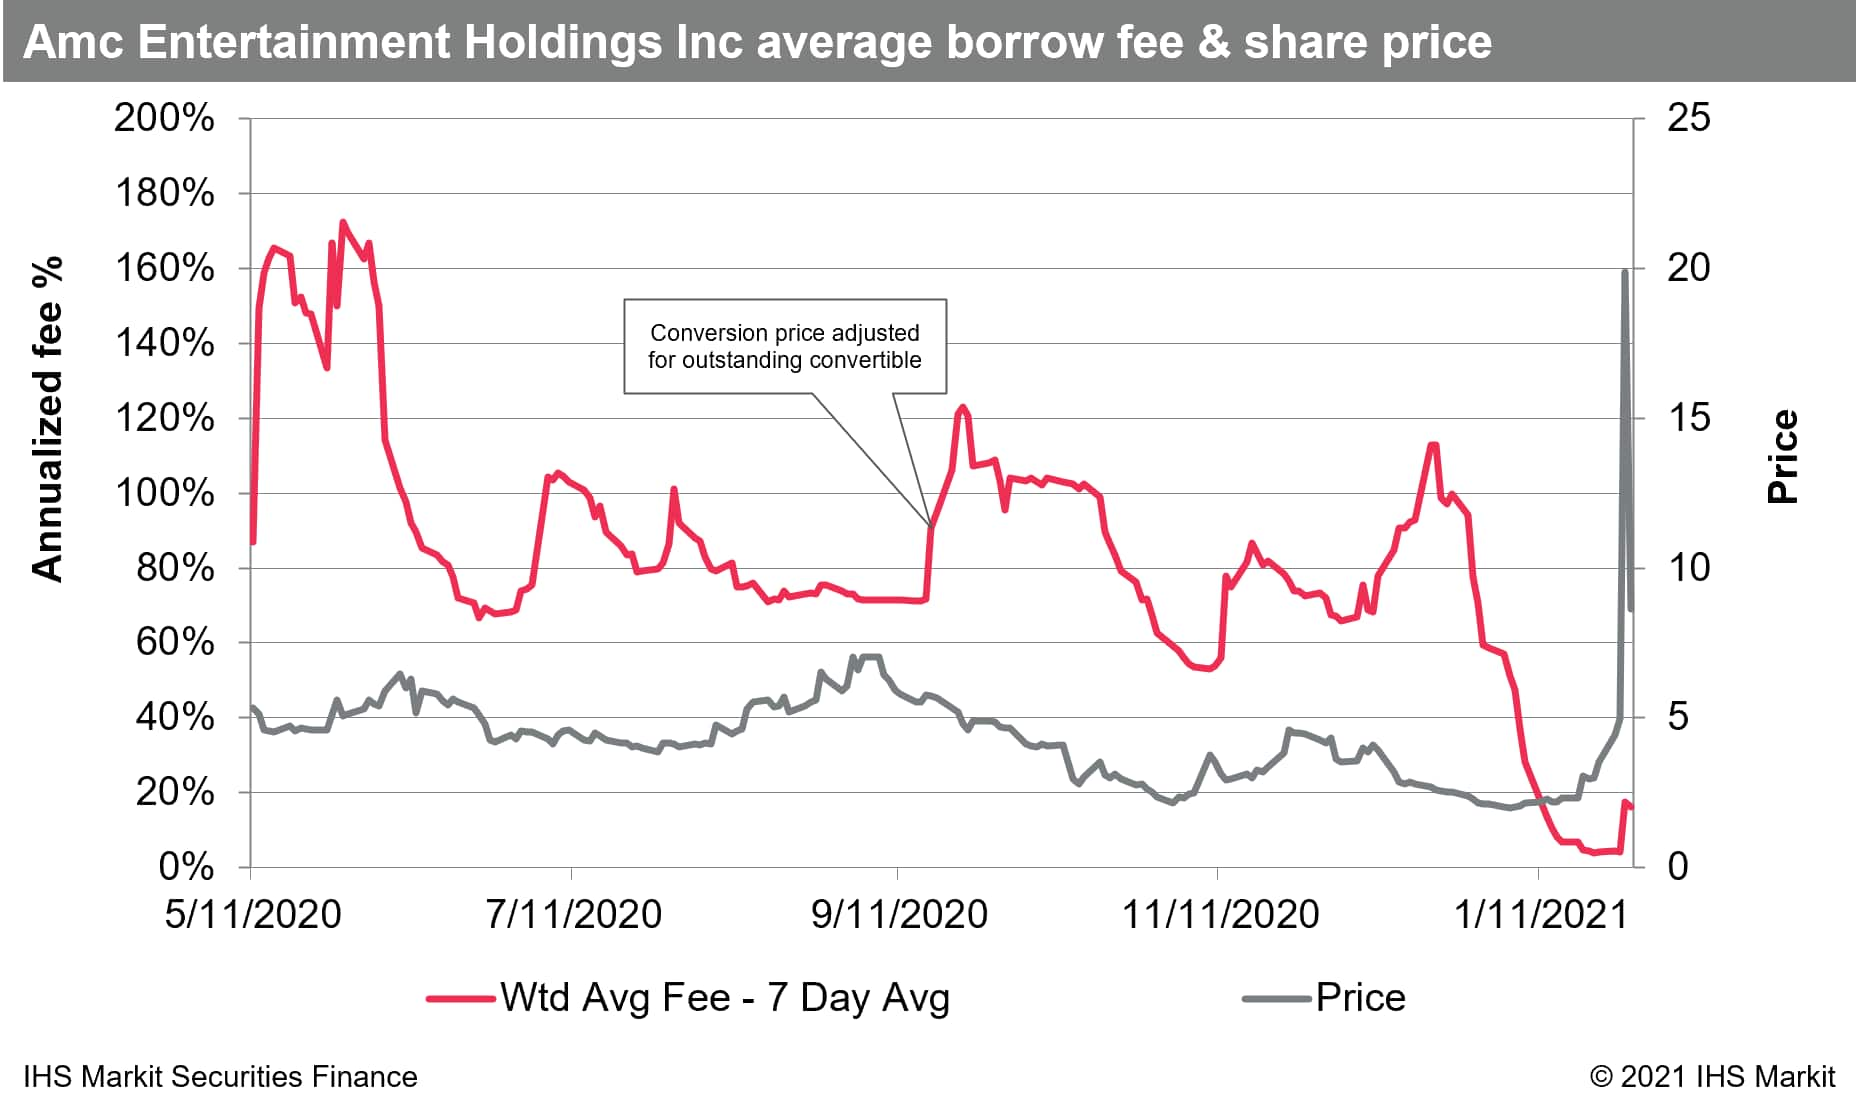
AMC Holdings serves as a reminder that short interest may be more than it seems. Firms in the movie theatre business have been popular shorts since the pre-COVID era and AMC was among the most heavily shorted firms in terms of both borrowing of the firm's bonds and equity at the start of 2020 (bond borrowing substantially unwound during March and April) . While a contingent of directional equity short sellers likely remains in the trade, a portion of the recent AMC short position is likely related to hedging the firm's outstanding convertible debt, which was converted on January 27th. The process of hedging a long position in a convertible bond, when the common share price is increasing, involves shorting an increasing number of shares as the delta of the embedded call option approaches one. In practice, that will look like short sellers "fighting the tape" by shorting more shares as the price increases; taking full account of the trade, the price of the convertible bond may be increasing by more than the delta-adjusted hedge, delivering a profit to the arbitrageur. While there is not evidence regarding short positioning specific to the holder of the AMC convertible note, the tightening of the borrow on September 14th, after a reset provision was triggered for the outstanding convertible bond, which increased the number of shares each bond was convertible into, suggests convertible hedging was a meaningful factor for short positioning in the shares, as noted in our Q3 snapshot. The impact of convertible hedging may have recently increased amid the surge higher in share price, which would help to explain the increase in share borrowing despite what would appear to be a face-melting short squeeze.
3D Systems:
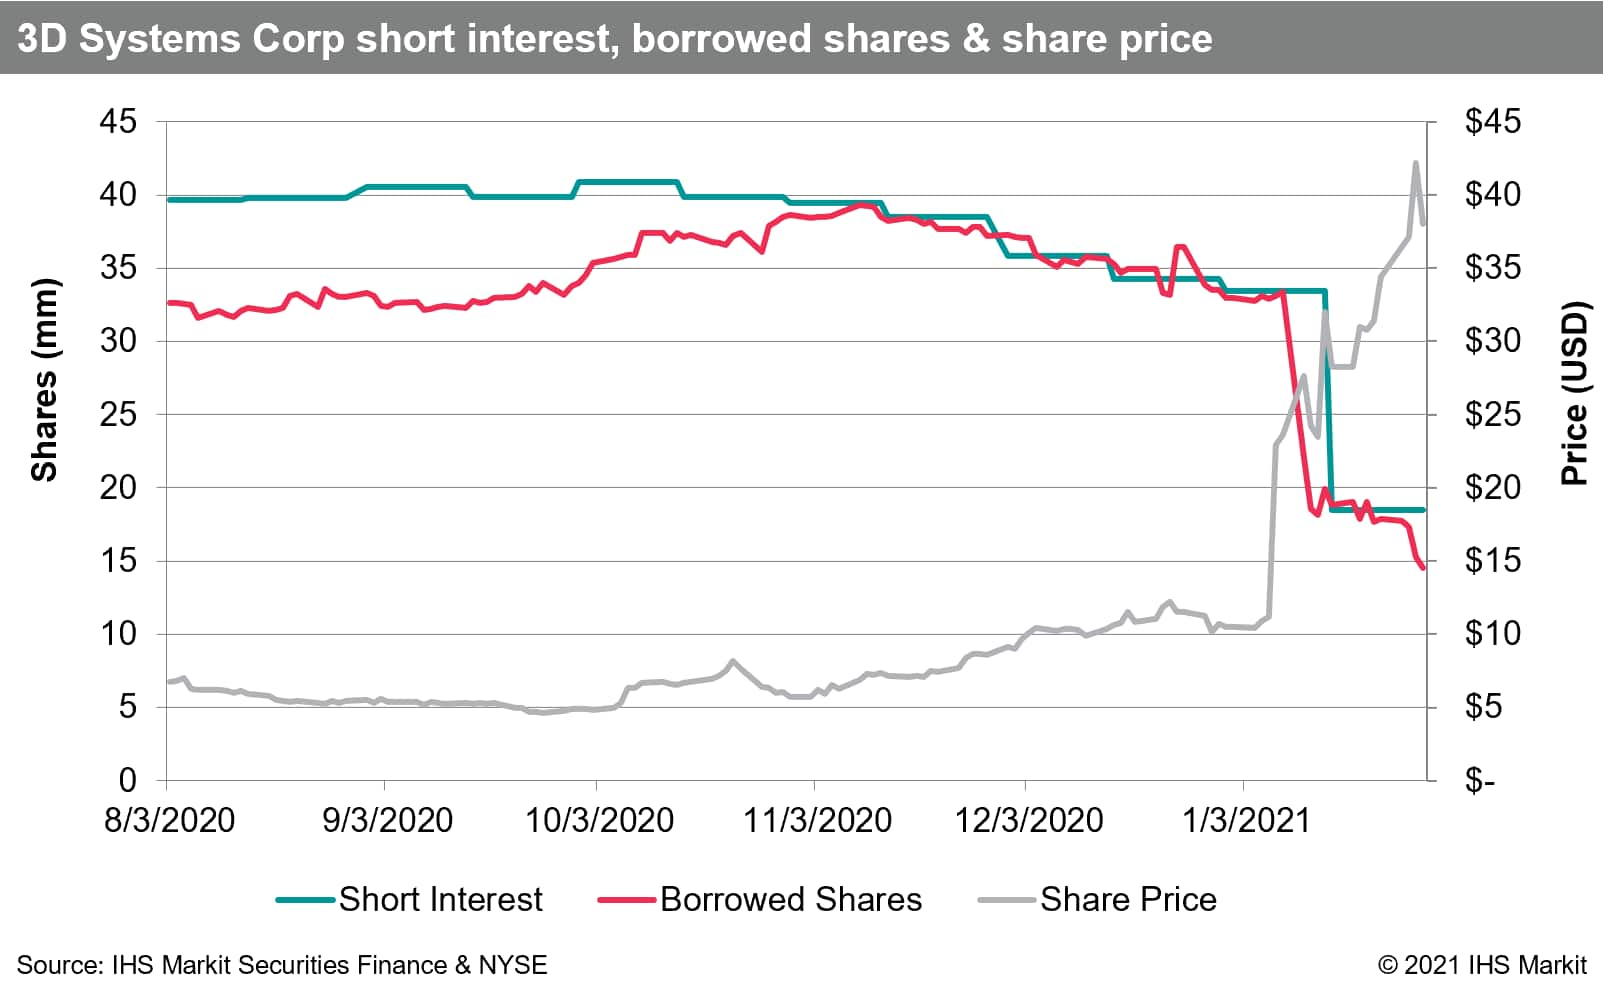
Sometimes a short squeeze can be fairly identified as such nearly in real-time, in the sense that a large decrease in total short positioning coincides with a substantial increase in share price. 3D Systems (DDD) is exemplary, with the shares on loan falling dramatically on the settlement date following the share price doubling on January 7th. The number of shares on loan declined by 14.8m shares, which may have had a material impact on the share price doubling, but it certainly was not the only contributor with more 197m shares of traded volume that day. The DDD share price has increased by another 65% since January 7th, with only a 5m share reduction in borrowing, suggesting that short covering has had rather minimal impact on the trend higher after the initial squeeze.
Conclusion:
When will the bad times end for short sellers? Has the short interest factor return inverted? These questions could have been asked at any point since last April, with no more certain of an answer on offer then as now. This moment is historically remarkable and, like so many financial time series, the returns for heavily shorted US equities will likely be measured against the last 12months for some time to come.
Stay tuned for securities finance and short selling commentary from IHS Markit Securities Finance!
S&P Global provides industry-leading data, software and technology platforms and managed services to tackle some of the most difficult challenges in financial markets. We help our customers better understand complicated markets, reduce risk, operate more efficiently and comply with financial regulation.
This article was published by S&P Global Market Intelligence and not by S&P Global Ratings, which is a separately managed division of S&P Global.