Customer Logins
Obtain the data you need to make the most informed decisions by accessing our extensive portfolio of information, analytics, and expertise. Sign in to the product or service center of your choice.
Customer Logins
BLOG
May 11, 2018
Best Q1 securities lending revenue since 2008
Best revenue quarter since 2008!
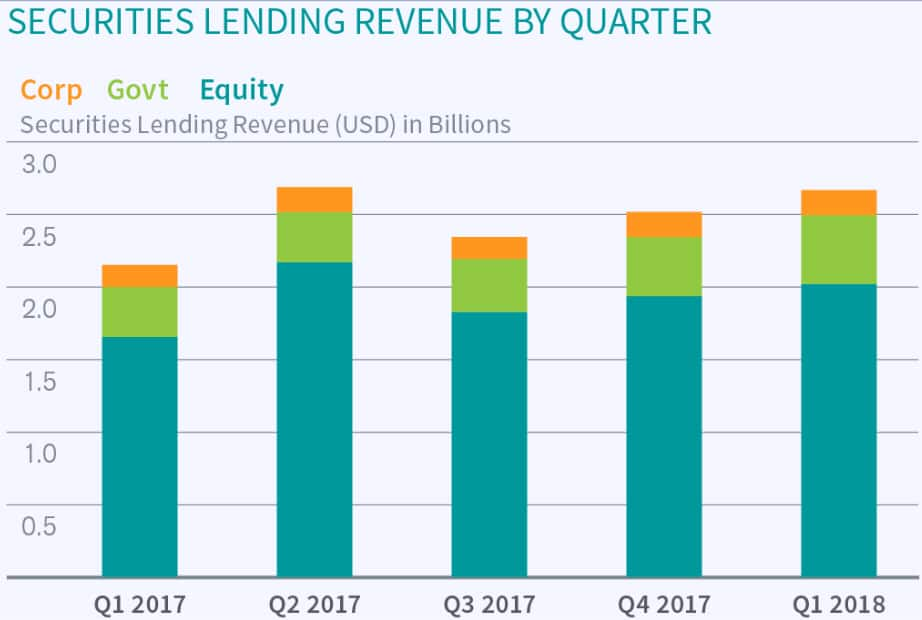
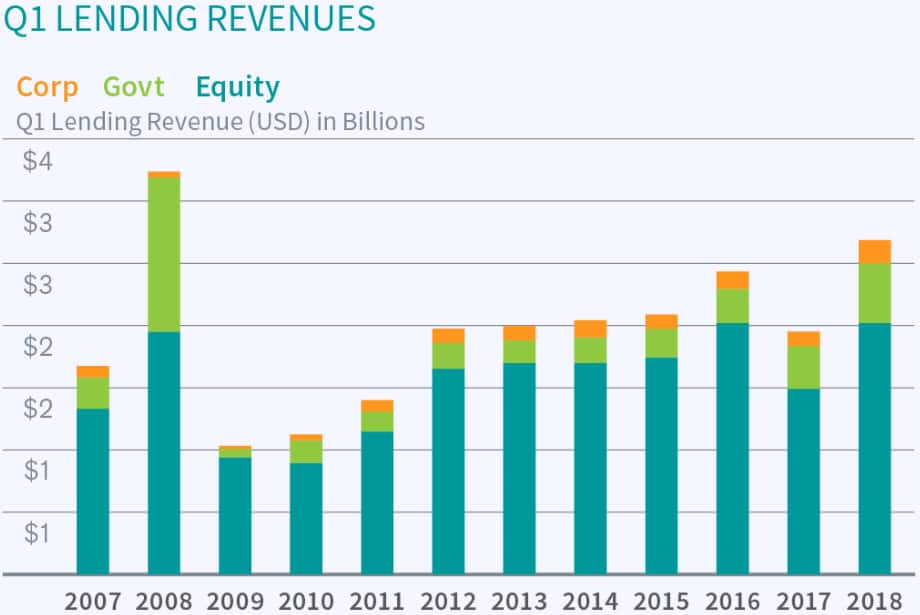
Global securities lending revenue had the best Q1 since 2008, delivering a total of $2.6bn. Revenues grew 22% as compared with Q1 2017, and narrowly exceeded Q1 2016, which had previously held the title of best post-crisis quarter. The internals of that return are important however, with government bond lending representing 18% of Q1 2018 revenue, where the asset class only contributed 11% of Q1 2016 revenue. Corporate bond revenue has also grown as a percentage of all lending revenue, delivering 7% of the Q1 total. While fixed income lending has certainly been growing faster than equities in percentage terms, Q1 equity lending revenue grew by $530m as compared to Q1 2017, with the $2bn in revenue nearly equaling Q1 2016.

The strong Q1 augurs well for the year overall, with Q1 very much setting the tone in each of the last two years. If the lending revenues for the next three quarters match their counterparts in 2017, total 2018 revenue will exceed $10bn for the first time since 2008, when the total was $11.8bn. That may well come to pass, however the industry will need to navigate Q2 given the critical upcoming earnings season, as well as tax reform issues.

The growth in equity lending revenue has been driven by Asia in recent years, with owners of Japanese equities enjoying Q1 revenue growth over 50% as compared with Q1 2017. The total Asia lending revenue of $518m was the highest level recorded (going back to 2006). This is the first Q1 on record where Asia has delivered higher total revenue than Europe.
North American equities also showed solid growth, with the $843m in revenue being an improvement of more than 30% as compared with Q1 2017, though this falls well short of the $973m in Q1 revenue from 2016. It was a similar story for European equities, which delivered $437m, an 18% improvement over Q1 2017, though this is still well below the $488m in Q1 2016 revenue.
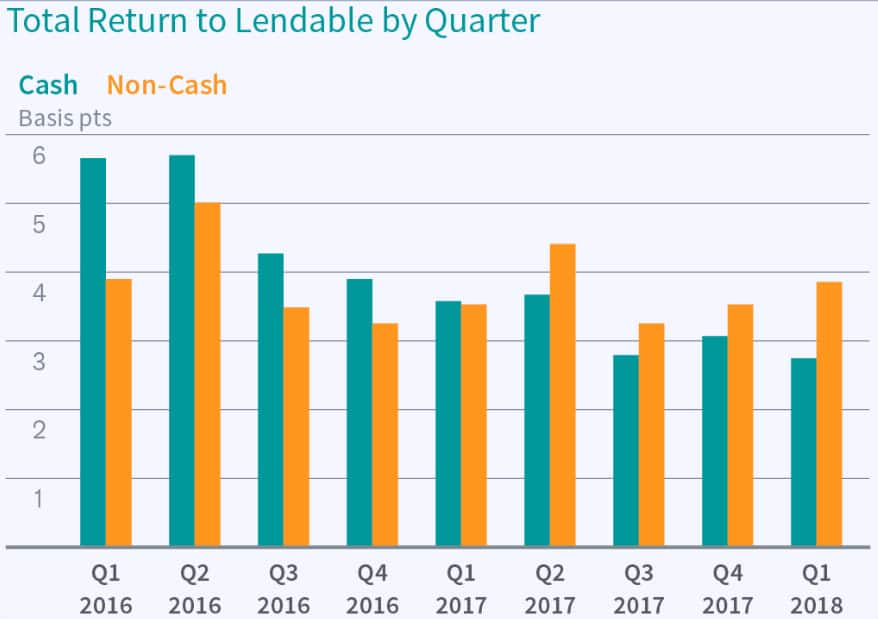
While a growing total pie is certainly a tailwind for beneficial owners, it is of no greater significance than the portion of that pie they are able to capture. A recurring theme in recent years has been declining equity utilization, and it makes sense that borrow demand would fail to keep pace with a relentless increase in equity valuations. The return to total lendable assets is therefore being pulled in two directions between increasing revenue and decreasing utilization.
A key differentiator for GC lending is collateral flexibility, with lenders who accept non-cash (and particularly equities) seeing an uptrend in utilization and a return to lendable over the last three quarters. These returns are inclusive of reinvestment for cash collateral lenders.

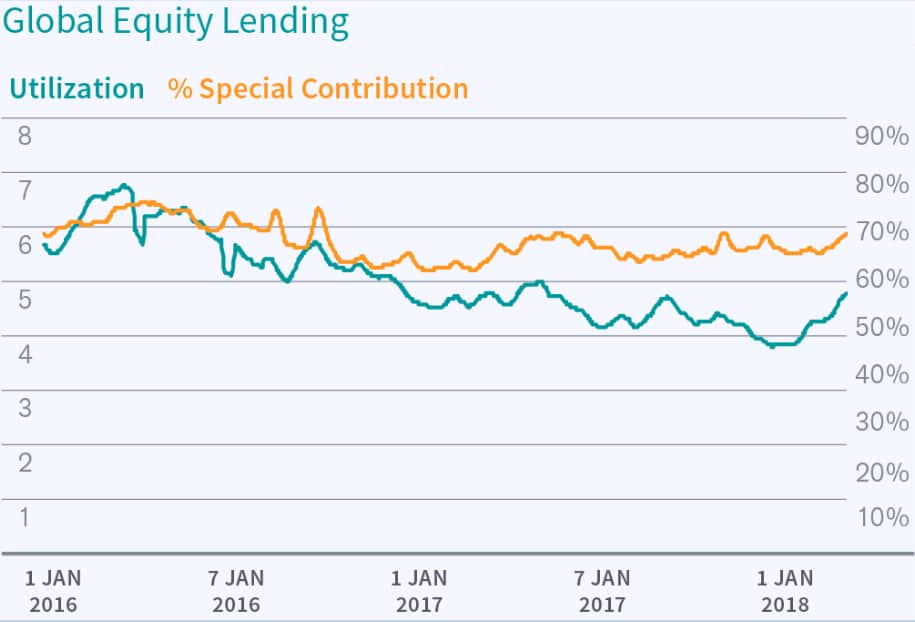
With the rally hitting the pause button in Q1, overall equity utilization has seen a welcome uptrend from the low at the end of 2017. Part of the story has been the demand for specials, which has been robust particularly in Asia, though the revenue contribution from specials was lower in Q1 2018 than it was in Q1 2016.

The tailwinds for the industry that we noted in the Q4 review remain in-tact, with equity GC and specials demand robust, corporate bond short demand back at post-crisis highs and demand for HQLA continuing its rapacious increase. The market volatility in Q1 has only enhanced these trends: with equity specials demand in US still well below levels observed in Q1 2016, there may be more improvement ahead, though the challenges experienced by short sellers in that year may be causing some reticence. There is further discussion of demand drivers in the closing section of this review, where we have a deep dive on equity and corporate bond ETF flows and constituent short demand.
The increase in Q1 revenue highlights a key benefit of participating in securities lending: revenues increase in times of market volatility. It's no coincidence that the high-revenue comps for Q1 were 2008 and 2016. This reflects the parallel value of securities lending for beneficial owners and long-short managers, namely both sides of the industry benefit tremendously from the increase in marginal returns during times of market stress.
Download PDFS&P Global provides industry-leading data, software and technology platforms and managed services to tackle some of the most difficult challenges in financial markets. We help our customers better understand complicated markets, reduce risk, operate more efficiently and comply with financial regulation.
This article was published by S&P Global Market Intelligence and not by S&P Global Ratings, which is a separately managed division of S&P Global.
{"items" : [
{"name":"share","enabled":true,"desc":"<strong>Share</strong>","mobdesc":"Share","options":[ {"name":"facebook","url":"https://www.facebook.com/sharer.php?u=http%3a%2f%2fwww.spglobal.com%2fmarketintelligence%2fen%2fmi%2fresearch-analysis%2fbest-q1-securities-lending-revenue-since-2008.html","enabled":true},{"name":"twitter","url":"https://twitter.com/intent/tweet?url=http%3a%2f%2fwww.spglobal.com%2fmarketintelligence%2fen%2fmi%2fresearch-analysis%2fbest-q1-securities-lending-revenue-since-2008.html&text=Best+Q1+securities+lending+revenue+since+2008+%7c+S%26P+Global+","enabled":true},{"name":"linkedin","url":"https://www.linkedin.com/sharing/share-offsite/?url=http%3a%2f%2fwww.spglobal.com%2fmarketintelligence%2fen%2fmi%2fresearch-analysis%2fbest-q1-securities-lending-revenue-since-2008.html","enabled":true},{"name":"email","url":"?subject=Best Q1 securities lending revenue since 2008 | S&P Global &body=http%3a%2f%2fwww.spglobal.com%2fmarketintelligence%2fen%2fmi%2fresearch-analysis%2fbest-q1-securities-lending-revenue-since-2008.html","enabled":true},{"name":"whatsapp","url":"https://api.whatsapp.com/send?text=Best+Q1+securities+lending+revenue+since+2008+%7c+S%26P+Global+ http%3a%2f%2fwww.spglobal.com%2fmarketintelligence%2fen%2fmi%2fresearch-analysis%2fbest-q1-securities-lending-revenue-since-2008.html","enabled":true}]}, {"name":"rtt","enabled":true,"mobdesc":"Top"}
]}


