Bank & Thrift Model II - 10 years after Lehman bankruptcy
Research Signals - September 2018
On 15 September 2008, Lehman Brothers filed for Chapter 11 bankruptcy protection, the largest corporate filing in US history, which most associate with sparking the financial crisis. While trust in Wall Street, government institutions and, especially, banks may have yet to fully recover, the Research Signals' Bank & Thrift Model II has been a trustworthy stock selection signal for US banks over the 10 years since that fateful day.
- Over the 10-year period since the Lehman bankruptcy, the model's buy portfolio outperformed the sell portfolio by 1.91% on average monthly
- Bank & Thrift Model II has been particularly effective at identifying high risk names to avoid
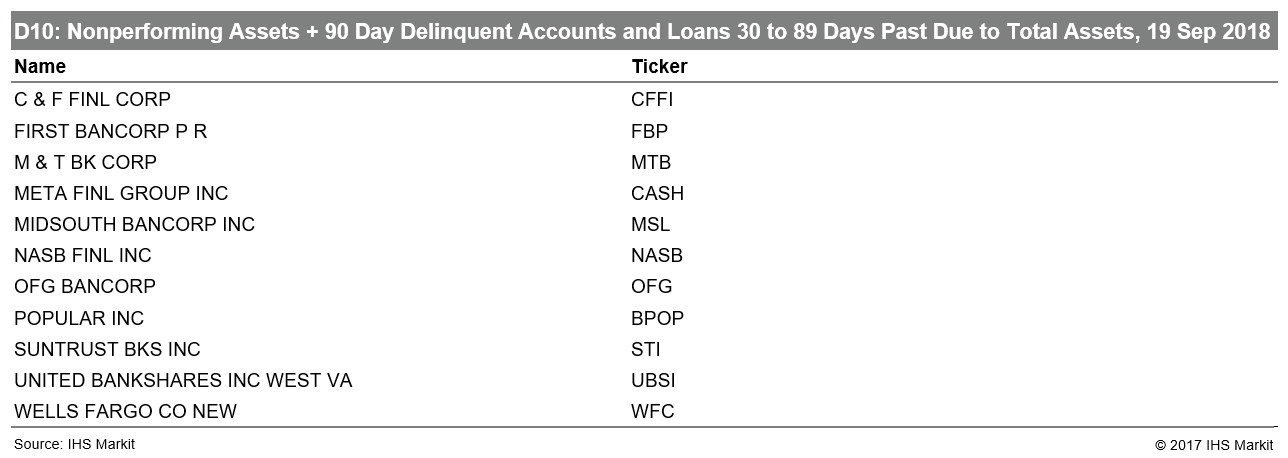
- Wells Fargo, SunTrust Banks and M&T Bank are currently ranked in the bottom decile of Nonperforming Assets + 90 Day Delinquent Accounts to Assets and Loans 30 to 89 Days Past Due to Total Assets
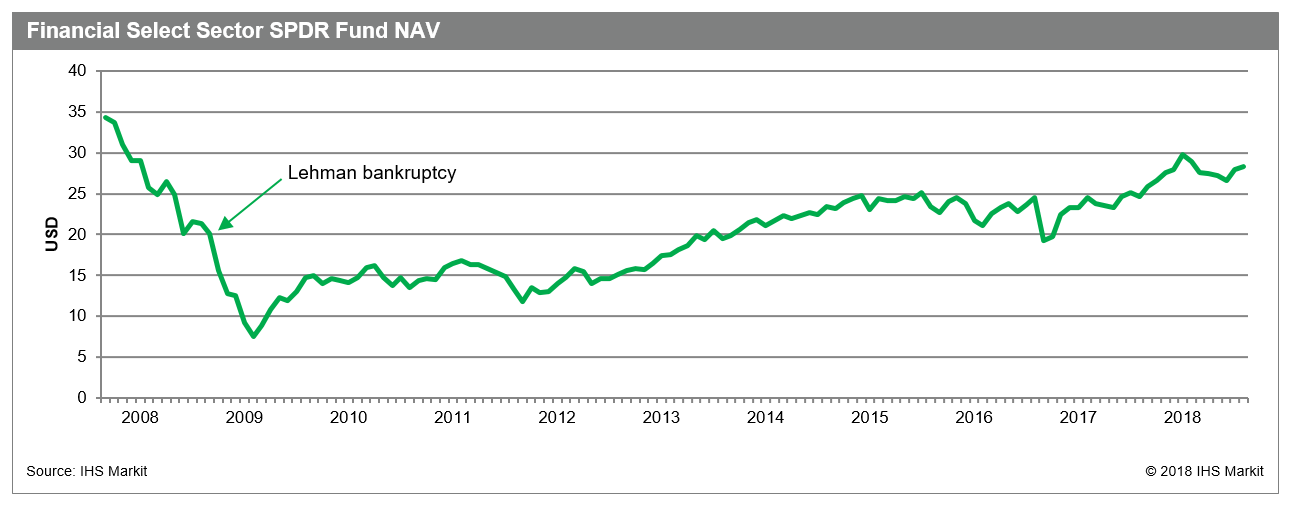
First, to review overall investor sentiment toward banks since the Lehman bankruptcy, we evaluate trends in the ETF market according to IHS Markit ETF Analytics. Looking to the Financial Select Sector SPDR Fund (XLF), the largest financial sector ETF, we find that the monthly NAV dropped off precipitously from September 2007 through September 2008 at a rate of -41.4% and bottomed at the end of February 2009 with a loss of -77.9%. While not returning to its previous highs, XLF recovered handsomely since the low with a 274% return through the end of August this year.
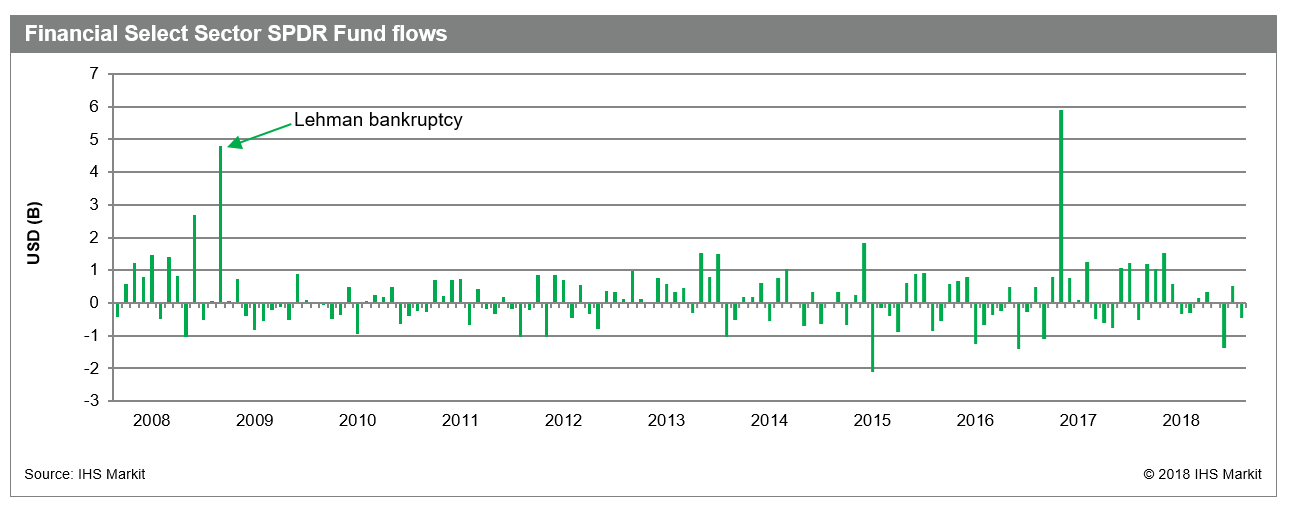
However, despite flagging market prices, investors poured a record amount of money (up to that point) into XLF in September 2008. In that month XLF saw an inflow of $4.8B, only to be outmatched eight years later at $5.9B in November 2016. In fact, for the year, inflows in 2008 reached $9.6B, though 2009 saw outflows of $1.7B.
Identifying high risk banks
Bank & Thrift Model II, which was upgraded in April 2010, is constructed of eight modules using specialty data sources to create industry-specific factors complemented by a broad set of style factors:
- Balance Sheet Strength
- Valuation
- Management Quality
- Asset Quality
- Earnings Momentum
- Investor Sentiment
- Price Momentum
- Earnings Quality
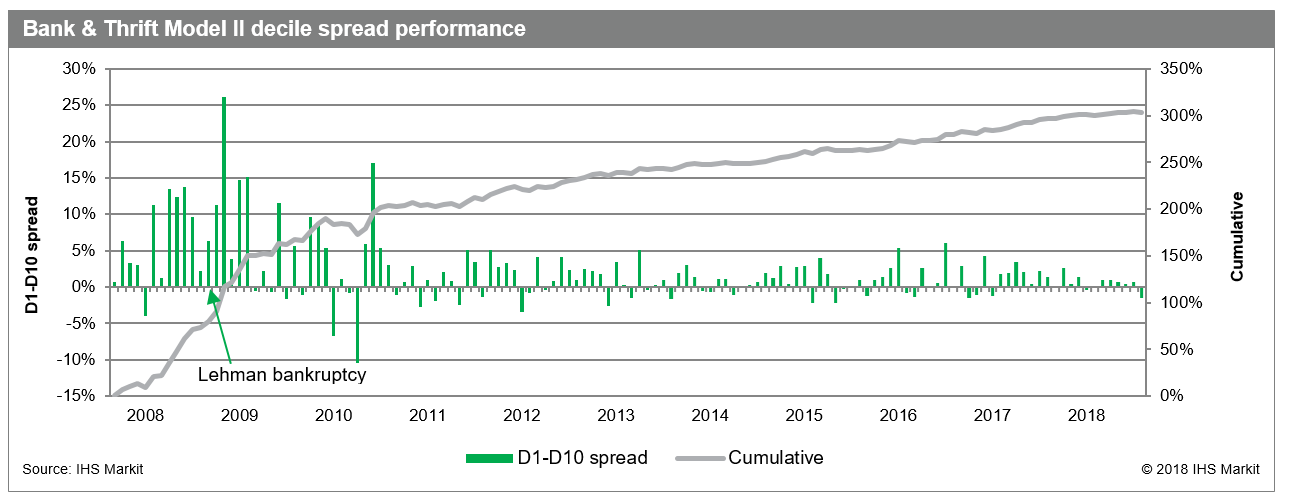
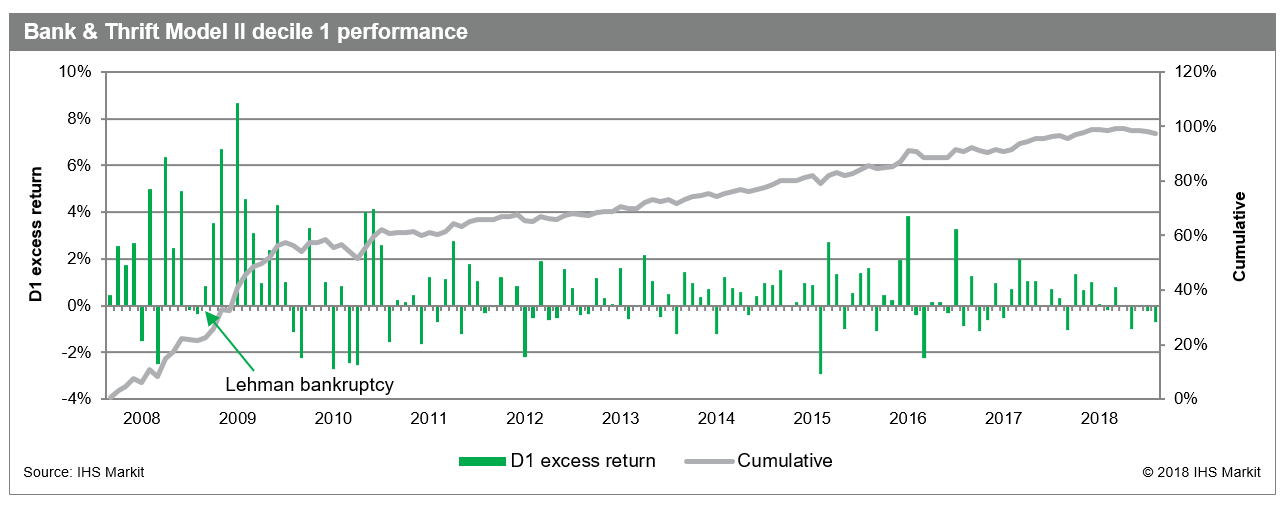
In computing monthly factor and model performance, stocks are divided into deciles with the highest 10% ranks comprising decile 1 (D1) and the lowest 10% ranks assigned to decile 10 (D10). Performance at the D1 and D10 extremes is computed based on average returns in excess of the market. The long-short spread is also calculated based on an investment strategy going long the highest ranked names (D1) and shorting the lowest (D10), capturing the D1-D10 spread which is a common gauge of overall model efficacy. Stocks included in the analysis are those in our US Bank universe which has averaged 250 names over the period and is currently comprised of 298 banks.
From September 2008 through August 2018, the model has recorded an average monthly decile spread of 1.91%, or 22.95% annualized, with positive performance in 70% of months. Subsequent to the April 2010 upgrade, the model posted an average monthly spread of 1.30% and 71% hit rate.
Both the buy (D1) and sell (D10) rated portfolios contributed to the strong performance, though with greater signal content in identifying higher risk names to avoid. D1 posted an average monthly return of 0.63% in excess of the market (7.58% annualized), with positive results in two-thirds of months. D10 stocks lagged the market by 1.28% on average monthly (-15.37% annualized), correctly underperforming in all but one-third of months.
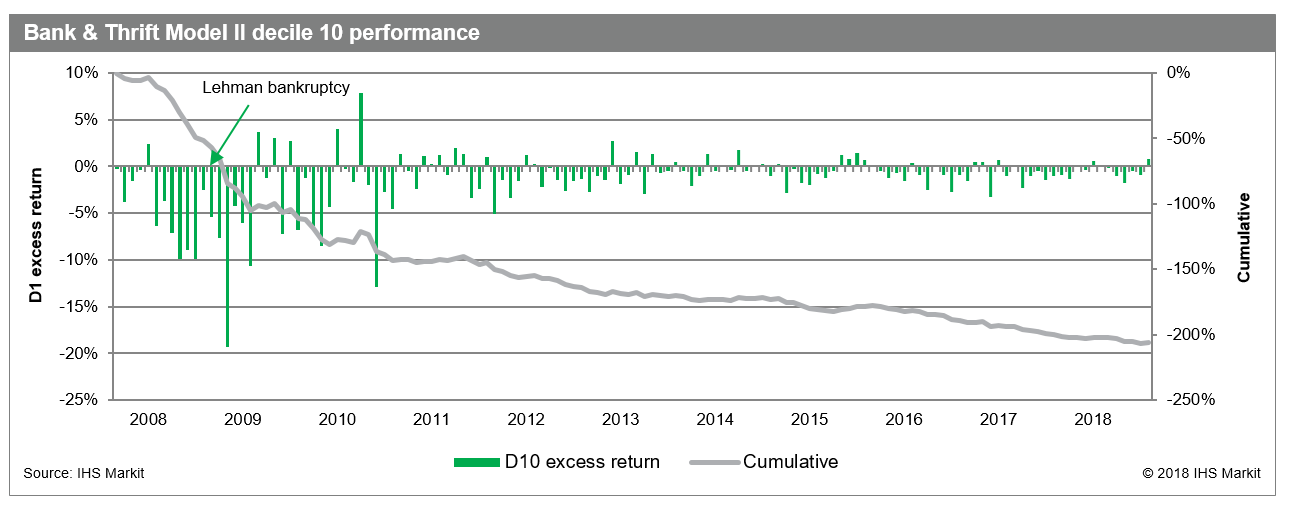
Some risk factors which were among the strongest performers over the period include two Asset Quality metrics - Nonperforming Assets + 90 Day Delinquent Accounts to Assets (D1-D10 spread: 0.88%) and Loans 30 to 89 Days Past Due to Total Assets (D1-D10 spread: 0.76%), which both reward banks with high quality balance sheets while penalizing those with a high proportion of loans at risk of default on their books. Performance was particularly driven by identifying names to avoid. Stocks which are currently ranked in the bottom decile of both indicators include Wells Fargo (WFC), SunTrust Banks (STI) and M&T Bank (MTB).
S&P Global provides industry-leading data, software and technology platforms and managed services to tackle some of the most difficult challenges in financial markets. We help our customers better understand complicated markets, reduce risk, operate more efficiently and comply with financial regulation.
This article was published by S&P Global Market Intelligence and not by S&P Global Ratings, which is a separately managed division of S&P Global.