Featured Topics
Featured Products
Events
S&P Global Offerings
Featured Topics
Featured Products
Events
S&P Global Offerings
Featured Topics
Featured Products
Events
S&P Global Offerings
Featured Topics
Featured Products
Events
Financial and Market intelligence
Fundamental & Alternative Datasets
Government & Defense
Banking & Capital Markets
Economy & Finance
Energy Transition & Sustainability
Technology & Innovation
Podcasts & Newsletters
Financial and Market intelligence
Fundamental & Alternative Datasets
Government & Defense
Banking & Capital Markets
Economy & Finance
Energy Transition & Sustainability
Technology & Innovation
Podcasts & Newsletters
BLOG — Mar 17, 2021
In 2020, China for the first time was seen as the EUs largest trade partner (when looking at Total Trade Value). Disruptions in supply chains appear to have destabilised bilateral trade within some of the EUs usual top trade partners, trade with China came out to be the least impacted. The table below shows how the year-on-year percent change hit the top ten partners more severely than China.
Table 1 EU External Trade with top partners, 2020 vs 2019
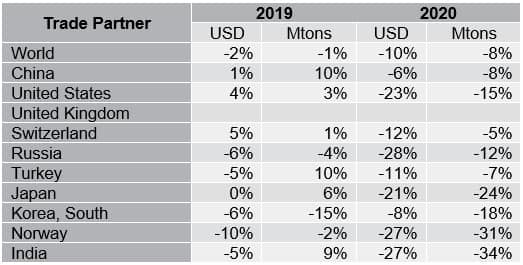
Source: IHS Markit Global Trade Atlas
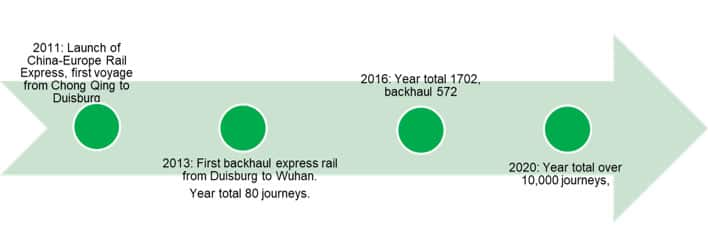
Particularly, while absolute trade growth is moderate and COVID-19 hit maritime trade, rail routes from China to EU reported a significant growth both in terms of trade value and volume. Actually, this growing trend of rail trade between the two economies has been lasting for years since Express Rail services between China and Europe gradually introduced, with over 10,000 journeys between the two continents on rail in 2020.
While maritime is still the dominant mode and a more mature transport means, rail is an emerging alternative for some market segments and supports trade development to those landlocked areas. Yet the potential is still yet to be released and will be relying on the level of standardisation, infrastructure, freight pricing and overall logistics matureness.
Trade statistics provides an opportunity for answering questions such as:
Figure 1 Timeline of China-Europe Rail Express
Summary and Implications
Trade between EU and China on rail is speeding up in recent years, since the introduction of express rail services. Rail mode remains a small portion comparing to maritime but has been growing fast both in terms of value and volume, and in both directions. Rail trade share in the bi-lateral trade has increased from <1% to around 4%. Trade in EU states en route and China railway hub regions - especially those landlocked areas, have been largely stimulated. Import into EU from China is still the main driver, yet backhaul trade has started to gain momentum in recent years and will be important to make the rail mode sustainable.
The commodities that opt for rail are also widely diverse ranging from industrial products such as mechanical, electronics, vehicle, to apparel, households, and food. Unit price could be a differentiator - as higher value goods tend to favour railway as an alternative transport mode or be part of the multi-modal services relaying long-haul sea journey and road / air traffic. But the railway trade could also be driven further by those time sensitive or fast-to-market consumer products.
Trade with China in 2020
During COVID-19, EU External trade experienced a drop both in terms of import and export. China for the first time became the largest trade partner of EU, particularly in terms of westbound trade, i.e. EU import from China. according to reported data by EU, import from China arrived at $443 billion USD representing 23% of total import. Although absolute trade value slightly contracted with a drop ~6%, this was much lower if comparing to its 15% decline of total import from the world.
Figure 2: EU Total External Trade and Trade with China
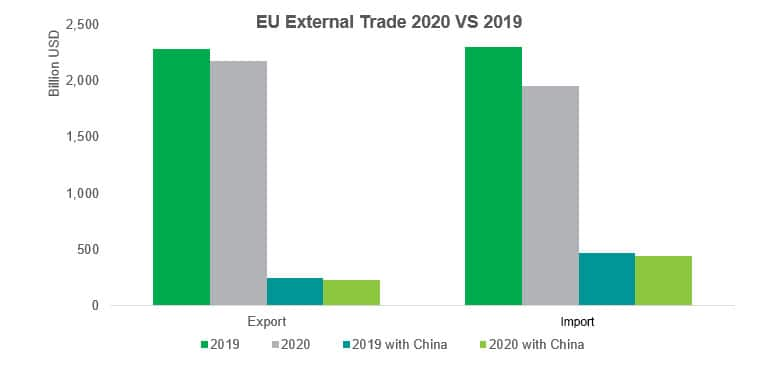
Source: IHS Markit Global Trade Atlas
Figure 3: Import Trade Partner Share in 2020
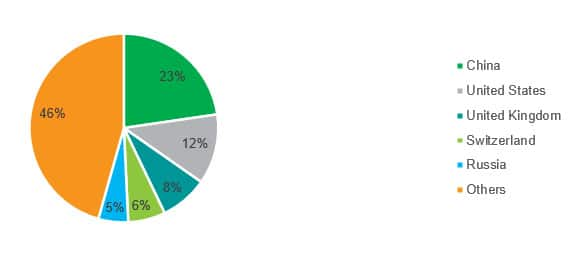
Source: IHS Markit Global Trade Atlas
Rail import trade from China
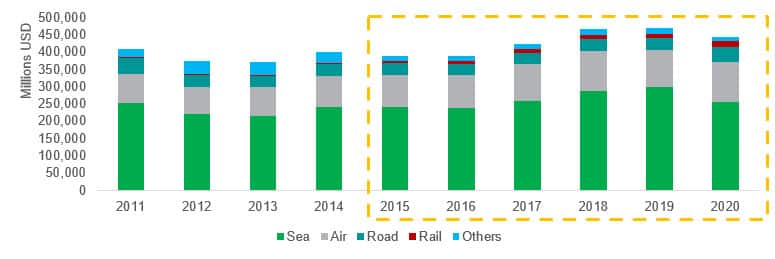
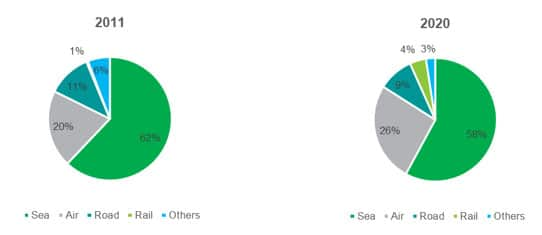
In general, the total trade volume has been on upward trend steadily since year 2016 until 2020 when the pandemic certainly inserted an unexpected negative effect. However, when looking at import value by transport mode, it is observed that rail transport - though is still a very insignificant percentage in terms of absolute value, the growth is significant with the share in total imports increasing from <1% in 2011 to 4% in 2020. Even in 2020 when maritime trade contracted, import by rail increased.
Figure 4: EU Import Trade value from China by Transport Mode 2011 - 2020
Source: IHS Markit Global Trade Atlas
Figure 5: Share change (2020 vs 2011) of different transport mode
Source: IHS Markit Global Trade Atlas
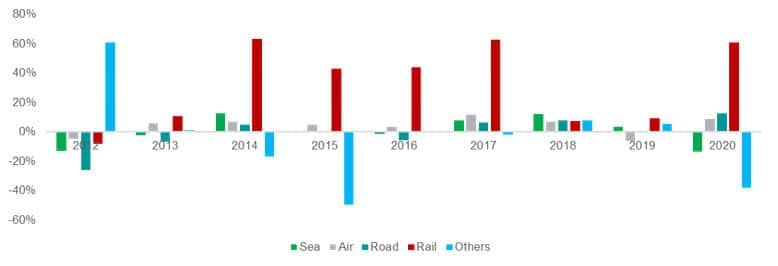
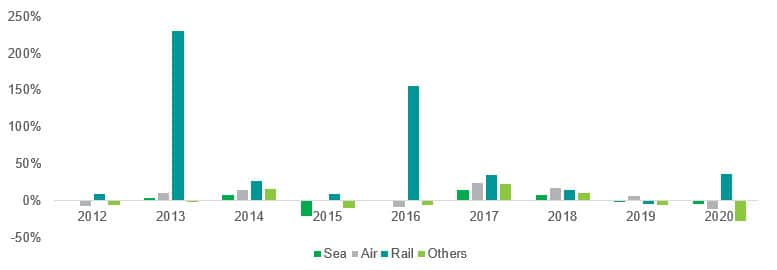
From Figure 6 below, we may also observe that since the launch of the express rail service, rail trade toward EU countries has grown quickly even in years when other transport mode has stalled. Though in the first a few years the freight subsidies provided some stimulus effect, as the market has become more mature and stable, the routes that sustained still recorded growth.
Figure 6: Import from China Annual growth rate by transport mode
Source: IHS Markit Global Trade Atlas
The trade volume and value by rail from China to EU is growing in tandem in recent years as shown in the figure below. During the period 2016 - 2020, i.e., since the launch of Express Rail service, trade volume has more than doubled with CAGR at 26.9%, reaching 1,580 thousand tonnes in 2020. That could be equivalent to over 70,000 TEU if assuming 20T per rail container.
Figure 7: Import by Rail Value and Volume (2011 - 2020)

Source: IHS Markit Global Trade Atlas
Regional Impact from Rail Trade
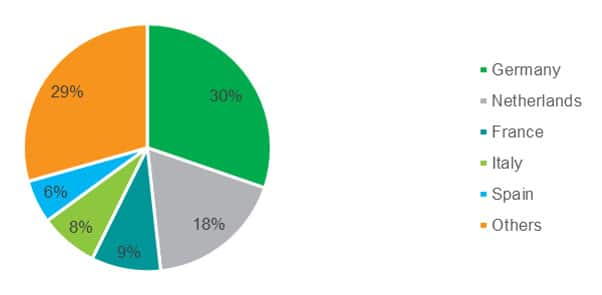
Counting all transport mode, large EU economies remain on the top in terms of import trade with China - as Figure 8 shows, Germany and Netherlands account for 30% and 18% respectively followed by France, Italy and Spain.
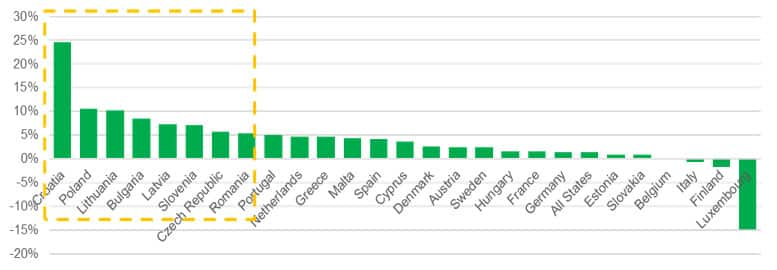
Yet if looking at the growth (Figure 9), there're emerging EU countries, including Poland, Croatia, Lithuania and those Baltic countries, recorded strong annual growth consecutively in the past decade. It looks though these countries are not traditional 'sea trading' nations and even without large seaports (or landlocked such as Austria, the Czech Republic, Hungary and Slovakia), import from China growth is consistent significant over the years.
Figure 8: All Transport Mode Import from China share
Source: IHS Markit Global Trade Atlas
Figure 9: CAGR by member states in past decade
Source: IHS Markit Global Trade Atlas
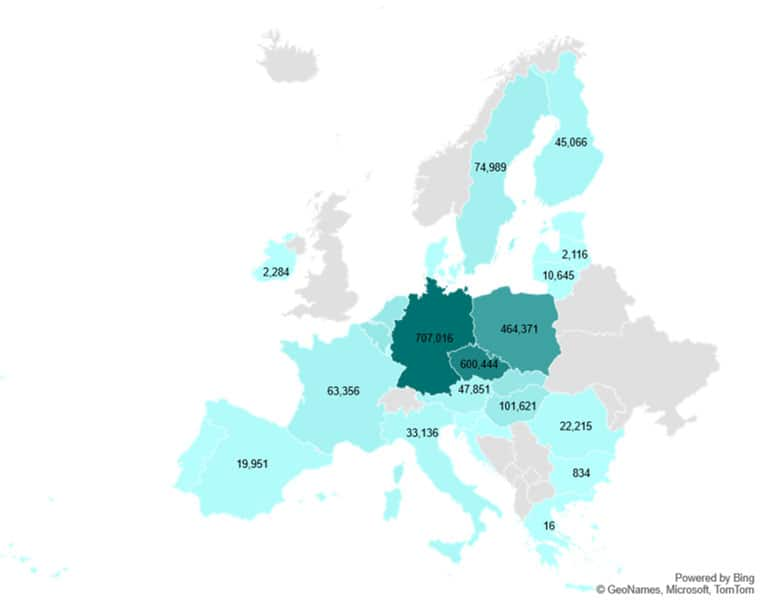
Focusing on rail mode import by looking at from import volume by each EU member states, as the map below shows, Germany, Poland and Austria are the top states that receive shipments by rail. Their adjacent smaller states are also importing notable volume if comparing to their total trade scale. Rail is possibly contributing much to the overall trade to these countries.
Figure 10: Import Volume (tonnes) by Rail from China (2020)
Source: IHS Markit Global Trade Atlas
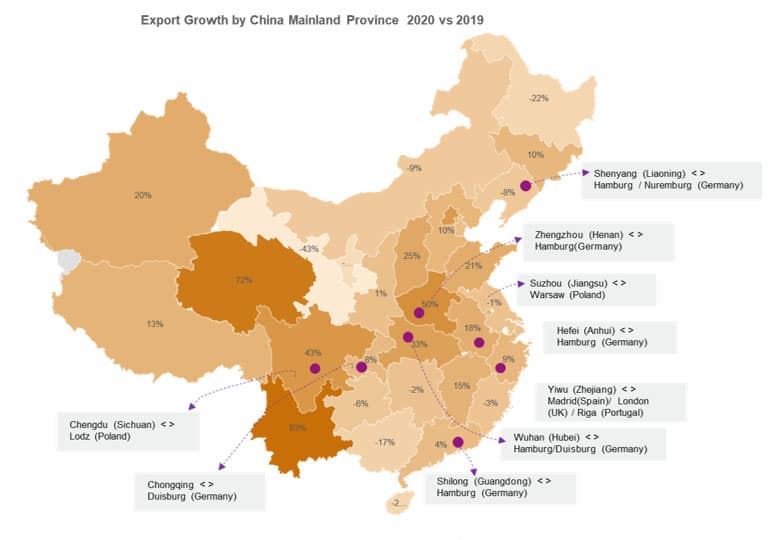
On the other side, rail transport also stimulates trade for those inland provinces in China. It is surprising to see that in 2020, when overall trade was not in best shape, these provinces with less sea connectivity are at the higher end of export growth spectrum. In general, there are 5-6 cities as the express rail hub sending block trains, including Chengdu, Chongqing, Yiwu, Suzhou, Zhengzhou, Wuhan and Shenyang - the rail service are advancing trade in their local areas and the adjacent provinces as well.
Figure 11 Major Rail Services and Annual Trade Growth in 2020 by Province
Source: IHS Markit Global Trade Atlas; China Railway website
This was not surprising if collectively looking at the express rail service routes as pointed out in Figure 11. The destinations in EU include Duisburg and Hamburg as the two largest hubs, then radiated to adjacent areas. For China, not only the provinces and countries where railway terminals locate, but also the adjacent areas have seen a positive growth - which could imply wider cargo catchment markets and local logistics network connectivity.
Sectorial Preference
What types of goods preferring rail as an alternative mode would be a question asked by logistics providers if they would like to enter the market and looking for potential clients and cargo market catchment. The advantage of using rail is, the speed and a competitive price comparing to airfreight. Typically, it would take two weeks on the way and comparing to ocean freight, it may interconnect with a road leg more seamlessly to provide a real 'door-to-door' service.
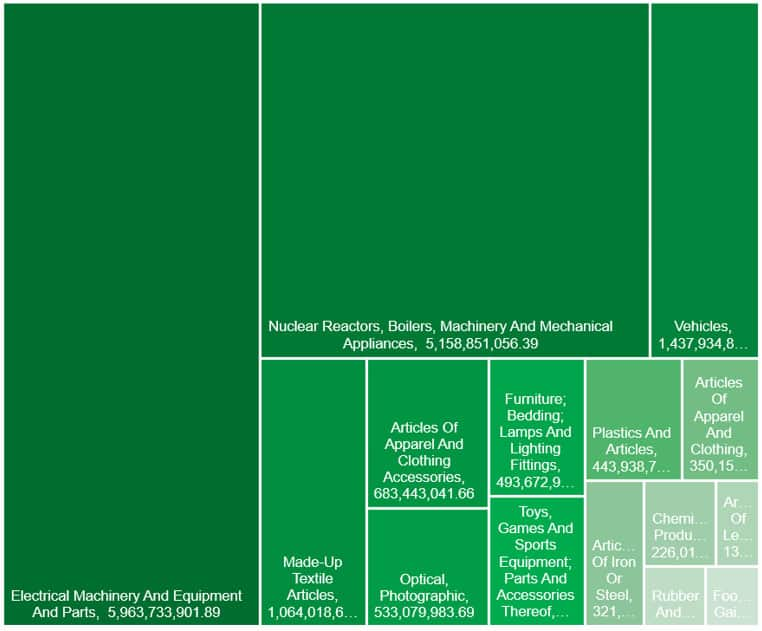
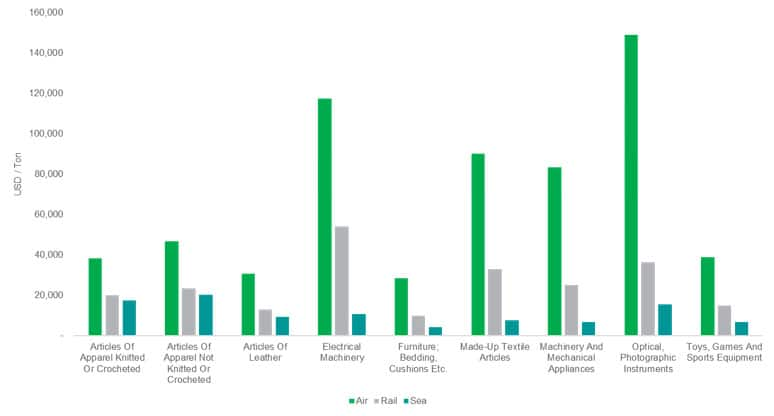
In 2020, some of the top listed commodities imported by railway from China include electric equipment ($5.96 billion), Nuclear reactors and boilers, machinery ($5.16 billion), and vehicles ($1.44 billion); however, it is also interesting to see textile and apparel cargo (i.e. HS 61 - 63) are also forming a large portion of rail carriage. Unit price of the shipments may give some implication when examining any transport mode is a good option for shippers. As may be expected, across all the top commodities, rail trade unit price is in between air and sea freight. The price gap seems most significant when it comes to consumer products such as made-up textiles articles and toys/game/sports equipment.
Figure 12: Top Commodities import by Rail (2-digit HS Code level)
Souce: IHS Markit Global Trade Atlas
Figure 13: Unit Price comparison of top commodities import by Rail
Source: IHS Markit Global Trade Atlas
The back-haul journey
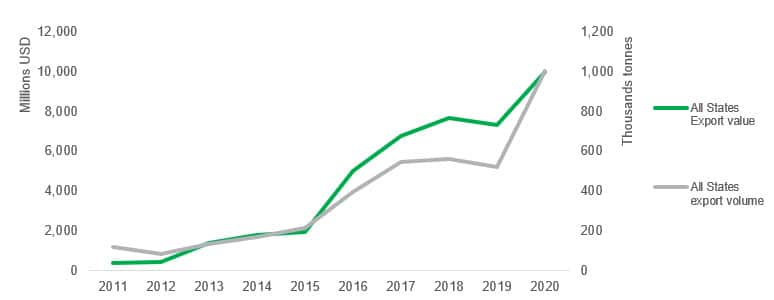
Since the launch of express rail, one of the questions frequently being asked is whether the backhaul trains (i.e., Europe to China) could be fully loaded considering the existing trade imbalance? This is also important for the rail freight and any infrastructure investment to be economic and sustainable over the years, thus worth looking at trade data when examining the market status and any segment potentials. From Figure 14, it seems in the initial years, backhaul trade started from nearly nothing and slowly ramped up; yet since 2016, the growth became more steady and in 2020, trade volume and value arrives at ~one million tonnes and ~ten billion USD.
Figure 14: EU to China trade by rail (2011 - 2020)
Source: IHS Markit Global Trade Atlas
Figure 15: Annual growth by mode
Source: IHS Markit Global Trade Atlas
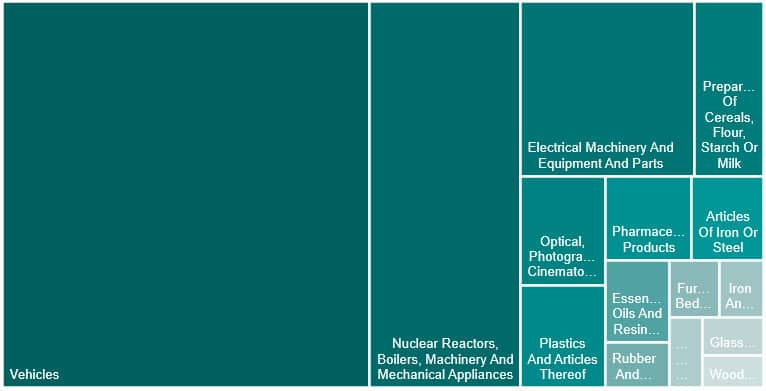
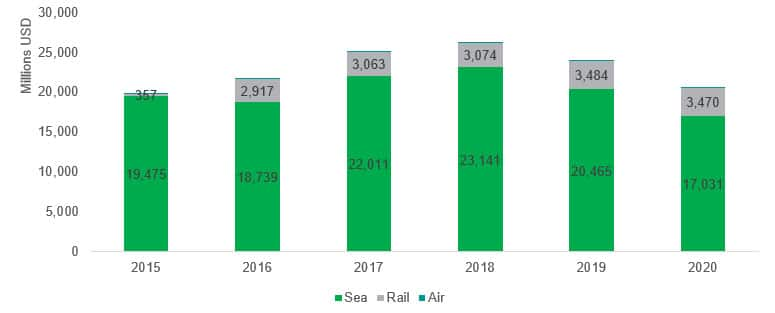
In terms of the type of cargo delivered from EU to China, industrial products particularly vehicles (HS 87) became a large contributor with products worth 4.5 billion delivered to China on rail, of which the passenger vehicle dominates over other sub items under the same HS chapter. Take this top one category as example, railway keep expanding in recent years, with passenger cars worth 3.47 billion USD export to China in 2020. Among the top export commodities, we also notice that food (such as milk products) and cosmetics, which could to some extent owing to the consumer market or e-commerce demand a faster delivery service.
Figure 16: Top Commodities export to China by Rail
Source: IHS Markit Global Trade Atlas
Figure 17: Vehicle export to China by transport mode
Source: IHS Markit Global Trade Atlas
Subscribe to our monthly newsletter and stay up-to-date with our latest analytics
Posted 17 March 2021 by Yingzhi Zhang, Subject Matter Expert, Maritime,Trade & Supply Chain, S&P Global Market Intelligence
How can our products help you?
