Customer Logins
Obtain the data you need to make the most informed decisions by accessing our extensive portfolio of information, analytics, and expertise. Sign in to the product or service center of your choice.
Customer Logins
EQUITIES COMMENTARY
Jan 28, 2016
Return of the REIT picker
Thwarted by interest rate jitters REITs delivered a lacklustre performance in 2015. However, superior selection criteria could have delivered market beating returns for investors.
- Markit's REIT model delivers the best returns since 2011 in a flat REIT market during 2015
- Strong inflows into VNQ ETF for the latter half of 2015 continue into 2016 with $800m of inflows
- Short sellers attracted to US REITS as VNQ average constituent short interest rises a third
REITs reeling in the funds
ETFs representing real estate investment exposure in the US has mushroomed over the past ten years, growing fivefold from under $10bn in AUM in 2006 across 6 products, to $43bn currently spread across 28 products.
US real estate investment trusts or REITs, which are required to distribute 90% of their predominantly rental income streams to shareholders, outperformed the general market in 2014 as yield hungry investors sought alternatives to declining treasury yields.
2015 saw the REITs cool off as an imminent interest rate rise loomed. Interest rates impact not only the relative valuation metrics of REITs as a yielding security but impact the debt financing costs.
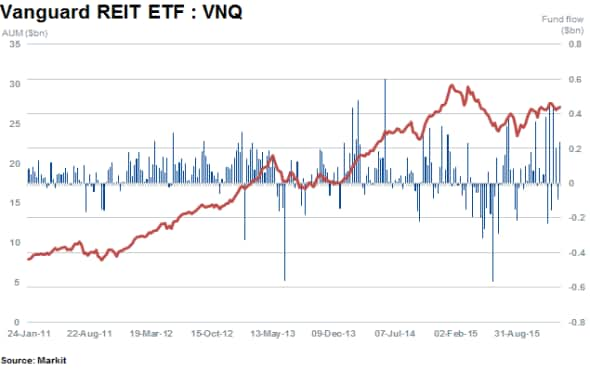
The tough operating environment is evidenced by the flat returns delivered by the asset class last year. The Vanguard REIT ETF (VNQ) which tracks the asset class, ended down 0.9% for 2015 on a total returns basis. This has continued into the New Year as the fund is down over 3% year to date.

Despite the fund's poor performance, investors have continued to pour money into the asset class with the trend accelerating in the current market. While the first half of last year saw investors pull $2.1bn from the fund; these outflows were more than reversed in the second half as investors ploughed $2.9bn into the fund. VNQ has seen $800m of inflows so far in January, the most in over 13 months.
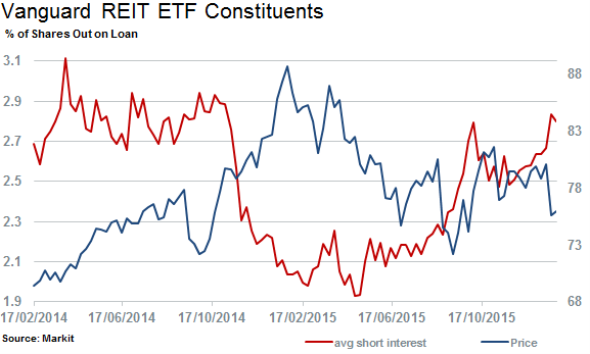
Its constituents have also come under pressure as average shorting activity (as tracked by the percentage of shares out on loan) has surged in the REITs that currently make up VNQ. Current demand to borrow the funds constituents now stands at 2.8% of shares outstanding, levels not seen since the end of 2014.

Market beating model REIT returns
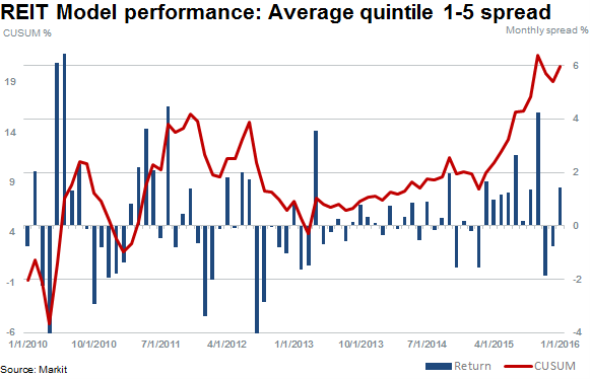
The pedestrian returns delivered across REITs in 2015 provided a solid footing for Markit's REIT model* which recorded its highest average monthly returns since 2011 after a testing year in 2012.

2015 was positive for stock pickers in the asset class as the business environment impacted each REIT differently. The models top underlying return drivers were associated with the Management Quality and Business Strategy component ranking of the underlying REIT securities.
Shorting the least attractive REITs (identified by using 8 modules that make up the composite model and going long the most attractive names) showed that 2015 model returns were able to outpace the model's long term monthly average performance of 0.67%, delivering 0.75% per month on average.
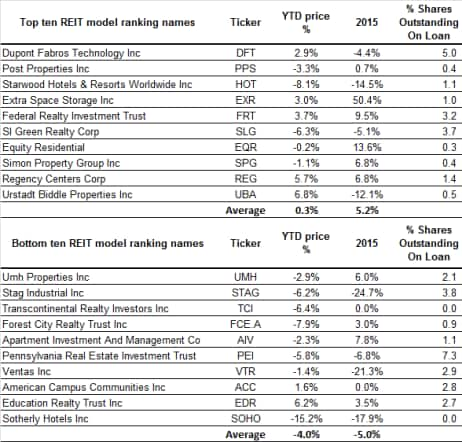
The current top and bottom ten ranked companies according to the REIT model composite model are listed below:

Across this discrete cross section of approximately 140 names, average returns for the top ten averaged 5.2% in 2015 and negative 5% for the bottom ten. The model has continued its current strong run of form in the new year as the return spread between the two polar ends of the universe stands at 1.4% so far in January.
*The Markit REIT Model is a bottom-up approach designed to systematically evaluate publicly traded US REITs. The model combines various fundamental indicators, property-level metrics and investor sentiment to identify companies that are poised for out or under performance.
Relte Stephen Schutte | Analyst, Markit
Tel: +44 207 064 6447
relte.schutte@markit.com
S&P Global provides industry-leading data, software and technology platforms and managed services to tackle some of the most difficult challenges in financial markets. We help our customers better understand complicated markets, reduce risk, operate more efficiently and comply with financial regulation.
This article was published by S&P Global Market Intelligence and not by S&P Global Ratings, which is a separately managed division of S&P Global.
{"items" : [
{"name":"share","enabled":true,"desc":"<strong>Share</strong>","mobdesc":"Share","options":[ {"name":"facebook","url":"https://www.facebook.com/sharer.php?u=http%3a%2f%2fwww.spglobal.com%2fmarketintelligence%2fen%2fmi%2fresearch-analysis%2f28012016-equities-return-of-the-reit-picker.html","enabled":true},{"name":"twitter","url":"https://twitter.com/intent/tweet?url=http%3a%2f%2fwww.spglobal.com%2fmarketintelligence%2fen%2fmi%2fresearch-analysis%2f28012016-equities-return-of-the-reit-picker.html&text=Return+of+the+REIT+picker","enabled":true},{"name":"linkedin","url":"https://www.linkedin.com/sharing/share-offsite/?url=http%3a%2f%2fwww.spglobal.com%2fmarketintelligence%2fen%2fmi%2fresearch-analysis%2f28012016-equities-return-of-the-reit-picker.html","enabled":true},{"name":"email","url":"?subject=Return of the REIT picker&body=http%3a%2f%2fwww.spglobal.com%2fmarketintelligence%2fen%2fmi%2fresearch-analysis%2f28012016-equities-return-of-the-reit-picker.html","enabled":true},{"name":"whatsapp","url":"https://api.whatsapp.com/send?text=Return+of+the+REIT+picker http%3a%2f%2fwww.spglobal.com%2fmarketintelligence%2fen%2fmi%2fresearch-analysis%2f28012016-equities-return-of-the-reit-picker.html","enabled":true}]}, {"name":"rtt","enabled":true,"mobdesc":"Top"}
]}


