Customer Logins
Obtain the data you need to make the most informed decisions by accessing our extensive portfolio of information, analytics, and expertise. Sign in to the product or service center of your choice.
Customer Logins
EQUITIES COMMENTARY
May 25, 2016
Short sellers zero in on US election wage talk
Wages have played a key role in rhetoric around the current US election, encouraging sellers to position themselves to profit from a rise in wages.
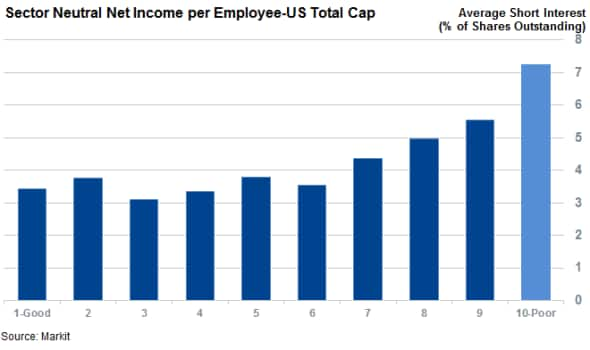
- Shorting among US firms with the worst net income to employee is 63% higher than average
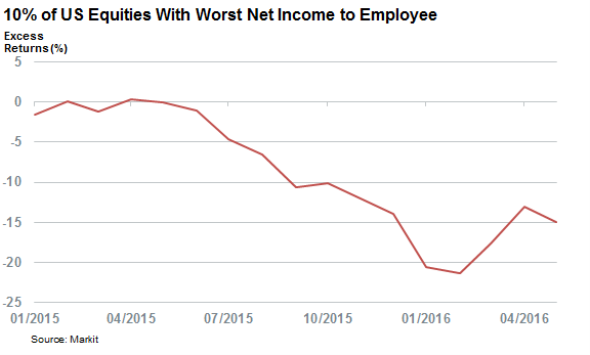
- Low net income to employee firms have underperformed the market by 15% since Jan 2015
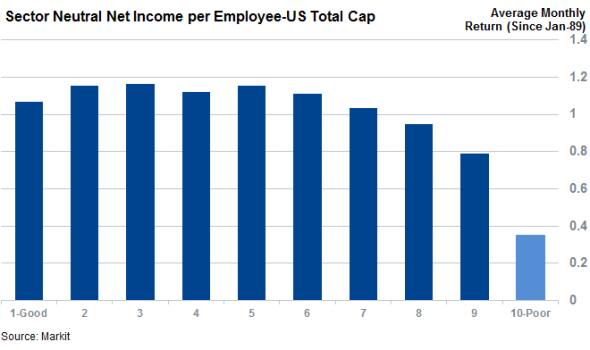
- Firms with poor net income to employee dynamics have only delivered one third of the market returns since 1989
Wages have been a core issue of the current US election cycle with all three of the current front running candidates having made some overtures to raising the minimum wage. While some have questioned Donald Trump's commitment to raising the rate, his two potential democratic nominees have both been much more forthright in their support for raising the federal rate from the current $7.25 to $12.0 or above. Any of these initiatives have the potential to further fuel wage growth past the current post recession high should they prevail; potentially eating into corporate profit margins.
Short sellers have positioned to profit from this trend as US stocks which have the worst net income per employee dynamics see much higher shorting activity than the rest of the market. Average short interest across the worst ranked 10% of US equities ranked by the Markit Research Signals net income per employee factor now stands at 7.3% of shares outstanding - over two thirds higher than the average seen across the rest of the market.

This trend also extends to the second worst performing sector which has over one quarter more shorting activity on average than the rest of the market.
Low margin firms underperform
The market has also been picking up on that trend as the worst ranked group of US shares has lagged the market by quite a wide margin since the US election picked up in earnest in the last 12 months. Shares with poor net income to employee profiles performed in line with the rest of the market for the first six months of last year, but these shares went on to underperform by 21% in the subsequent nine months.

While these shares did bounce back somewhat in March and April, these stocks are still nearly 15% behind the returns delivered by the 3000 constituents of the US total cap universe, making them the worst performing group by quite a wide margin.
Long term trend
This underperformance from US firms with thin net income to employee ratios is nothing new as the 10th decile firms have only delivered one third of the returns seen in the rest of the market in the last 26 years. These firms have returned 0.35% per month on average since January 1989. This trend compounds to a staggering 200% of underperformance over this long term horizon.

Simon Colvin | Research Analyst, Markit
Tel: +44 207 264 7614
simon.colvin@markit.com
S&P Global provides industry-leading data, software and technology platforms and managed services to tackle some of the most difficult challenges in financial markets. We help our customers better understand complicated markets, reduce risk, operate more efficiently and comply with financial regulation.
This article was published by S&P Global Market Intelligence and not by S&P Global Ratings, which is a separately managed division of S&P Global.
{"items" : [
{"name":"share","enabled":true,"desc":"<strong>Share</strong>","mobdesc":"Share","options":[ {"name":"facebook","url":"https://www.facebook.com/sharer.php?u=http%3a%2f%2fwww.spglobal.com%2fmarketintelligence%2fen%2fmi%2fresearch-analysis%2f25052016-Equities-Short-sellers-zero-in-on-US-election-wage-talk.html","enabled":true},{"name":"twitter","url":"https://twitter.com/intent/tweet?url=http%3a%2f%2fwww.spglobal.com%2fmarketintelligence%2fen%2fmi%2fresearch-analysis%2f25052016-Equities-Short-sellers-zero-in-on-US-election-wage-talk.html&text=Short+sellers+zero+in+on+US+election+wage+talk","enabled":true},{"name":"linkedin","url":"https://www.linkedin.com/sharing/share-offsite/?url=http%3a%2f%2fwww.spglobal.com%2fmarketintelligence%2fen%2fmi%2fresearch-analysis%2f25052016-Equities-Short-sellers-zero-in-on-US-election-wage-talk.html","enabled":true},{"name":"email","url":"?subject=Short sellers zero in on US election wage talk&body=http%3a%2f%2fwww.spglobal.com%2fmarketintelligence%2fen%2fmi%2fresearch-analysis%2f25052016-Equities-Short-sellers-zero-in-on-US-election-wage-talk.html","enabled":true},{"name":"whatsapp","url":"https://api.whatsapp.com/send?text=Short+sellers+zero+in+on+US+election+wage+talk http%3a%2f%2fwww.spglobal.com%2fmarketintelligence%2fen%2fmi%2fresearch-analysis%2f25052016-Equities-Short-sellers-zero-in-on-US-election-wage-talk.html","enabled":true}]}, {"name":"rtt","enabled":true,"mobdesc":"Top"}
]}


