Customer Logins
Obtain the data you need to make the most informed decisions by accessing our extensive portfolio of information, analytics, and expertise. Sign in to the product or service center of your choice.
Customer Logins
ECONOMICS COMMENTARY
Jul 22, 2015
Reliable PMI-based nowcasts of UK GDP available two months ahead of official data
PMI" business survey data are widely used to provide an advance indication of official data, in particular economic growth as measured by gross domestic product. The survey data have the advantage of being published monthly with minimal delay, meaning reliable estimates of GDP can be made more than two months before official data are available.
In the first instance, due to the extent to which official data are revised historically, it is important to consider which so-called 'vintage' of official data to compare against when deriving PMI-based estimates of GDP.
Historical comparisons also indicate that the best indications of first GDP estimates are made using only the first two months of PMI data for each quarter.
Pick your vintage
Chart 1 illustrates the extent to which GDP data get revised by the Office for National Statistics. While only relatively minor revisions are made between the first estimate of GDP (made around three weeks after the end of each quarter) and the first 'final' estimate (made around three months after the end of each quarter), the scale of revisions rises significantly in subsequent new 'final' estimates.
The revisions mean history is effectively retold: the correlation between first GDP estimates and the latest ONS revised estimates for the period 1998 to 2007 is just 0.06 (6%), i.e. there is no statistically significant correlation.
Chart 1: GDP 'vintages'
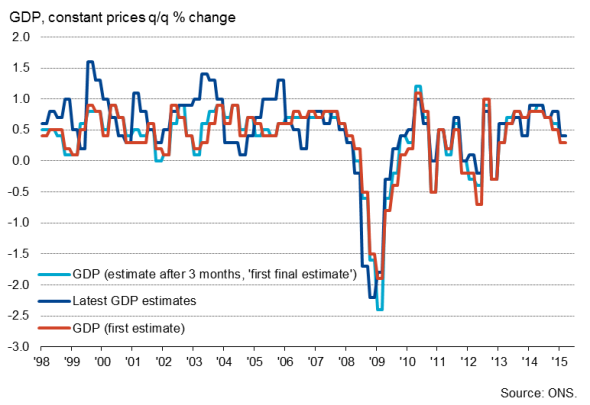
There are many reasons why GDP data are revised, but a common cause is the increase in information that becomes available after initial estimates are made. In particular, early GDP estimates are based almost entirely on data relating to how much has been produced, known as the output- or production-based estimates of GDP. This total has to subsequently be reconciled with later estimates of how much is spent and how much is earned in the economy, as in theory production-based GDP estimates should be equal to income- and expenditure-based GDP estimates.
This methodological distinction between the different 'vintages' of GDP is perhaps why PMI surveys - which measure companies' output - are more closely correlated with early production-based GDP estimates than subsequent income- or expenditure-based estimates (charts 2 and 3). The correlation between quarterly averages of PMI data (using a weighted sum of the output indices from the manufacturing, services and construction surveys) and the latest estimates of GDP between 1998 and 2015 is 0.65, but this rises to 0.80 if the PMI is compared with the first 'final' production-based GDP estimates (table 1).
Chart 2: PMI v GDP (latest estimates)
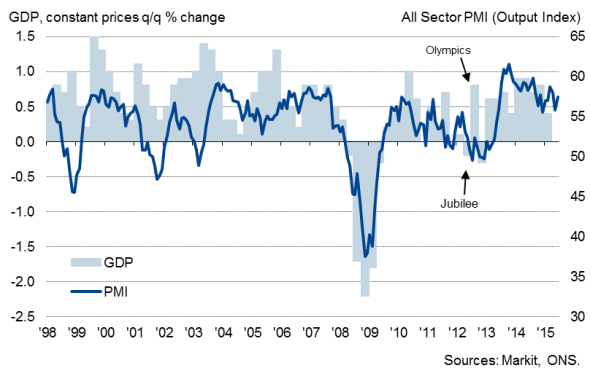
Chart 3: PMI v first 'final' GDP estimates
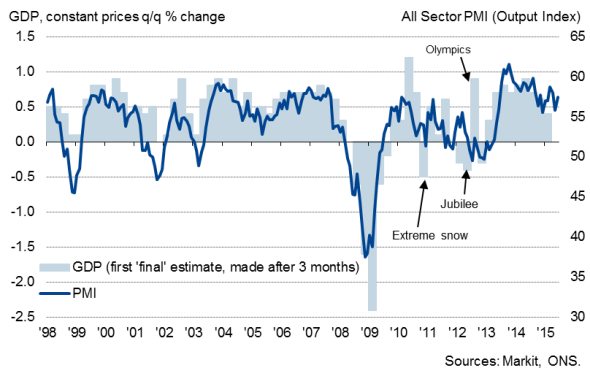
Table 1: Correlations between PMI and GDP (1998-2015)
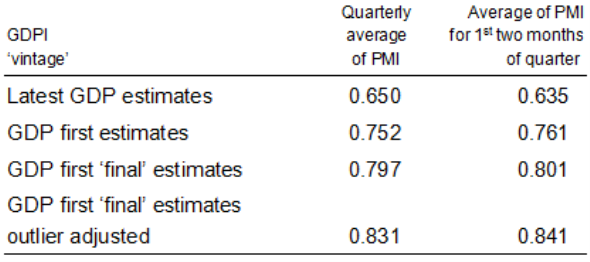
When seeking to anticipate GDP estimates, it is therefore important to compare the PMI with historical early estimates of GDP rather than the later GDP estimates which also incorporate income and expenditure data. The optimal regression is in fact one which uses the quarterly average of the PMI to explain first 'final' GDP estimates.
Furthermore, if appropriate adjustments are made to the official data for periods when the GDP data have been distorted by one-off events such as the Olympics (when ticket sales alone were estimated to have boosted GDP by 0.2%) and the Queen's Jubilee (which knocked 0.5% off GDP but is an event which survey respondents appear to have often made an automatic adjustment for when completing their questionnaires) the correlation rises further, and future PMI-based GDP estimates become more accurate .
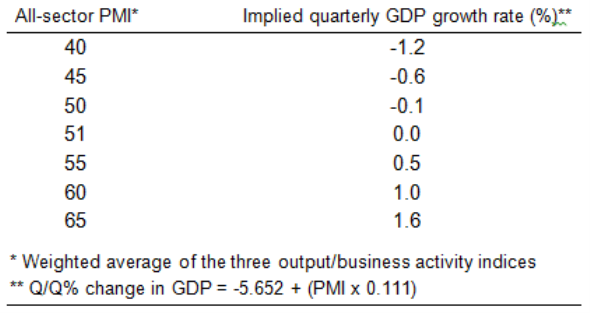
Table 2 shows the quarterly percent changes in GDP implied by PMI data on this basis, indicating that a PMI reading of 51.0 is equivalent to stagnant GDP and - as a rough rule of thumb - each index point is equivalent to a 0.1% change in GDP.
Table 2: PMI v GDP ready reckoner
Even earlier estimates
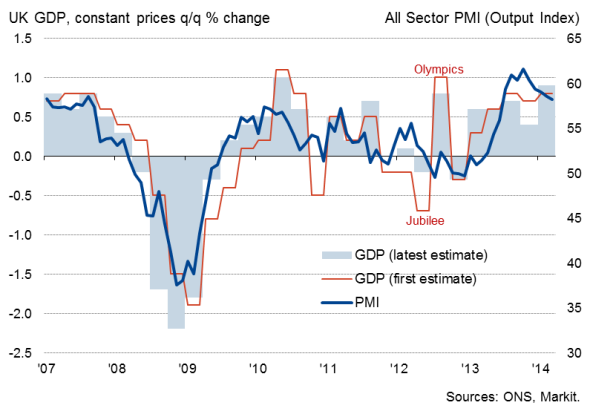
The accuracy of the PMI estimates of GDP are illustrated in chart 4, with the PMI offering the major advantage of being available immediately after each quarter has ended (services PMI data are published on the third working day). The first estimates of GDP are not generally available until 3-4 weeks later (The key divergences between the PMI signal and GDP occur between 2010 and 2013 when a variety of factors influenced GDP, distorting the underlying trend. As chart 6 illustrates, some of these distorting factors have already been revised away in more recent GDP estimates from the ONS.)
However, even timelier GDP estimates can be obtained by using the first two months of PMI data for each quarter (as chart 5 shows, these averages differ only marginally from the full quarter averages). In fact, the correlation rises marginally if the third month of PMI data for each data is excluded (see table 1), perhaps because early GDP estimates contain little data for the final month of the quarter. The regression statistics are largely unaffected, such that:
Q/Q% change in GDP = -5.637 + (PMI x 0.111)
This means that reliable PMI-based GDP estimates can be produced almost two months before the ONS publishes its first estimates.
Chart 4: PMI-based GDP nowcasts
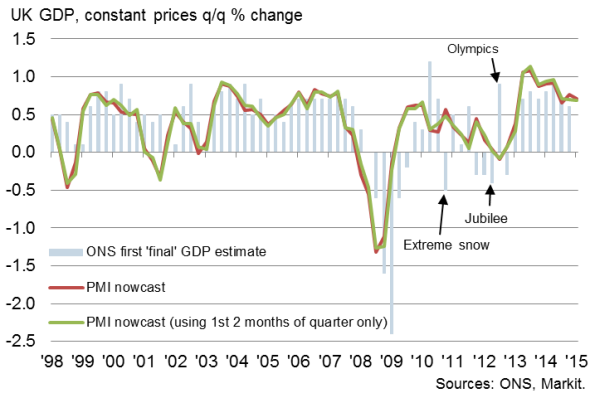
Chart 5: PMI quarterly averages
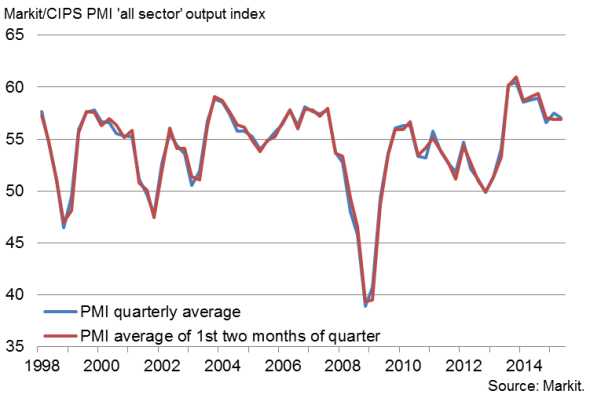
Chart 6: Recent revision to GDP
{"items" : [
{"name":"share","enabled":true,"desc":"<strong>Share</strong>","mobdesc":"Share","options":[ {"name":"facebook","url":"https://www.facebook.com/sharer.php?u=http%3a%2f%2fwww.spglobal.com%2fmarketintelligence%2fen%2fmi%2fresearch-analysis%2f22072015-Economics-Reliable-PMI-based-nowcasts-of-UK-GDP-available-two-months-ahead-of-official-data.html","enabled":true},{"name":"twitter","url":"https://twitter.com/intent/tweet?url=http%3a%2f%2fwww.spglobal.com%2fmarketintelligence%2fen%2fmi%2fresearch-analysis%2f22072015-Economics-Reliable-PMI-based-nowcasts-of-UK-GDP-available-two-months-ahead-of-official-data.html&text=Reliable+PMI-based+nowcasts+of+UK+GDP+available+two+months+ahead+of+official+data","enabled":true},{"name":"linkedin","url":"https://www.linkedin.com/sharing/share-offsite/?url=http%3a%2f%2fwww.spglobal.com%2fmarketintelligence%2fen%2fmi%2fresearch-analysis%2f22072015-Economics-Reliable-PMI-based-nowcasts-of-UK-GDP-available-two-months-ahead-of-official-data.html","enabled":true},{"name":"email","url":"?subject=Reliable PMI-based nowcasts of UK GDP available two months ahead of official data&body=http%3a%2f%2fwww.spglobal.com%2fmarketintelligence%2fen%2fmi%2fresearch-analysis%2f22072015-Economics-Reliable-PMI-based-nowcasts-of-UK-GDP-available-two-months-ahead-of-official-data.html","enabled":true},{"name":"whatsapp","url":"https://api.whatsapp.com/send?text=Reliable+PMI-based+nowcasts+of+UK+GDP+available+two+months+ahead+of+official+data http%3a%2f%2fwww.spglobal.com%2fmarketintelligence%2fen%2fmi%2fresearch-analysis%2f22072015-Economics-Reliable-PMI-based-nowcasts-of-UK-GDP-available-two-months-ahead-of-official-data.html","enabled":true}]}, {"name":"rtt","enabled":true,"mobdesc":"Top"}
]}


